Brought to you by , Funkhouser Real Estate Group, , scott@HarrisonburgHousingToday.com
Thursday, March 13, 2008
 Over the past few years, an increasing percentage of my buyer clients have been investors, who are purchasing income generating properties in Harrisonburg and Rockingham County. Most of those properties have been townhomes, with a few condos and a few single family homes mixed in. They have bought about an even mix of student housing and non-student housing.
 I love data analysis and statistics, and thus, it has been a fun and exciting part of my job to assist these investors in purchasing properties. Many of the investors that I have worked with have their own processes, techniques and spreadsheets for analyzing the value of an income generating investment property. They are looking at factors such as: depreciation, gross operating income, vacancy rates, annual operating expenses, cash flow, net operating income, return on investment, cap rates, etc.
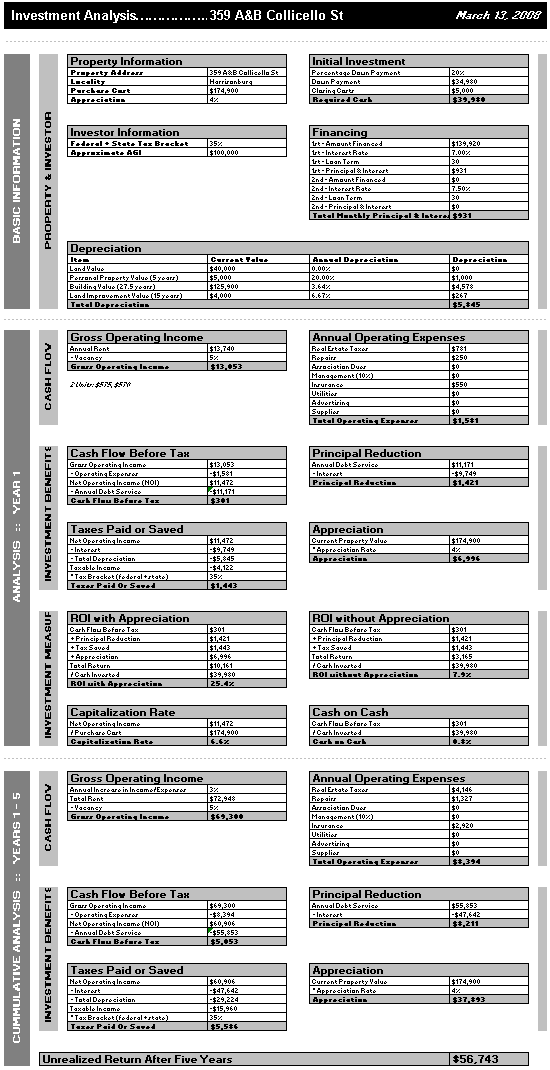
To better understand all of these concepts, and to better assist my buyer clients, I developed a spreadsheet (pictured below --- click on it for a more legible PDF version) to help analyze the value of an investment property. This analysis tool is helpful on a property-by-property basis, and also when comparing several investment opportunities side by side.
I spent a lot of time creating this analysis tool, and have received positive feedback from my investor clients. To make it time well spent:
- If you want to know more about real estate investing, let's get together and I'll walk you through this spreadsheet to explain the different concepts.
- If you are considering purchasing an investment property, I would be happy to analyze the value of the investment to help you make a well informed buying decision.
- If you currently own investment property, this tool can also be helpful in comparing the value of a property that you currently own with a possible replacement property.

