Far fewer homeowners are willing to sell these days

Scott P. Rogers
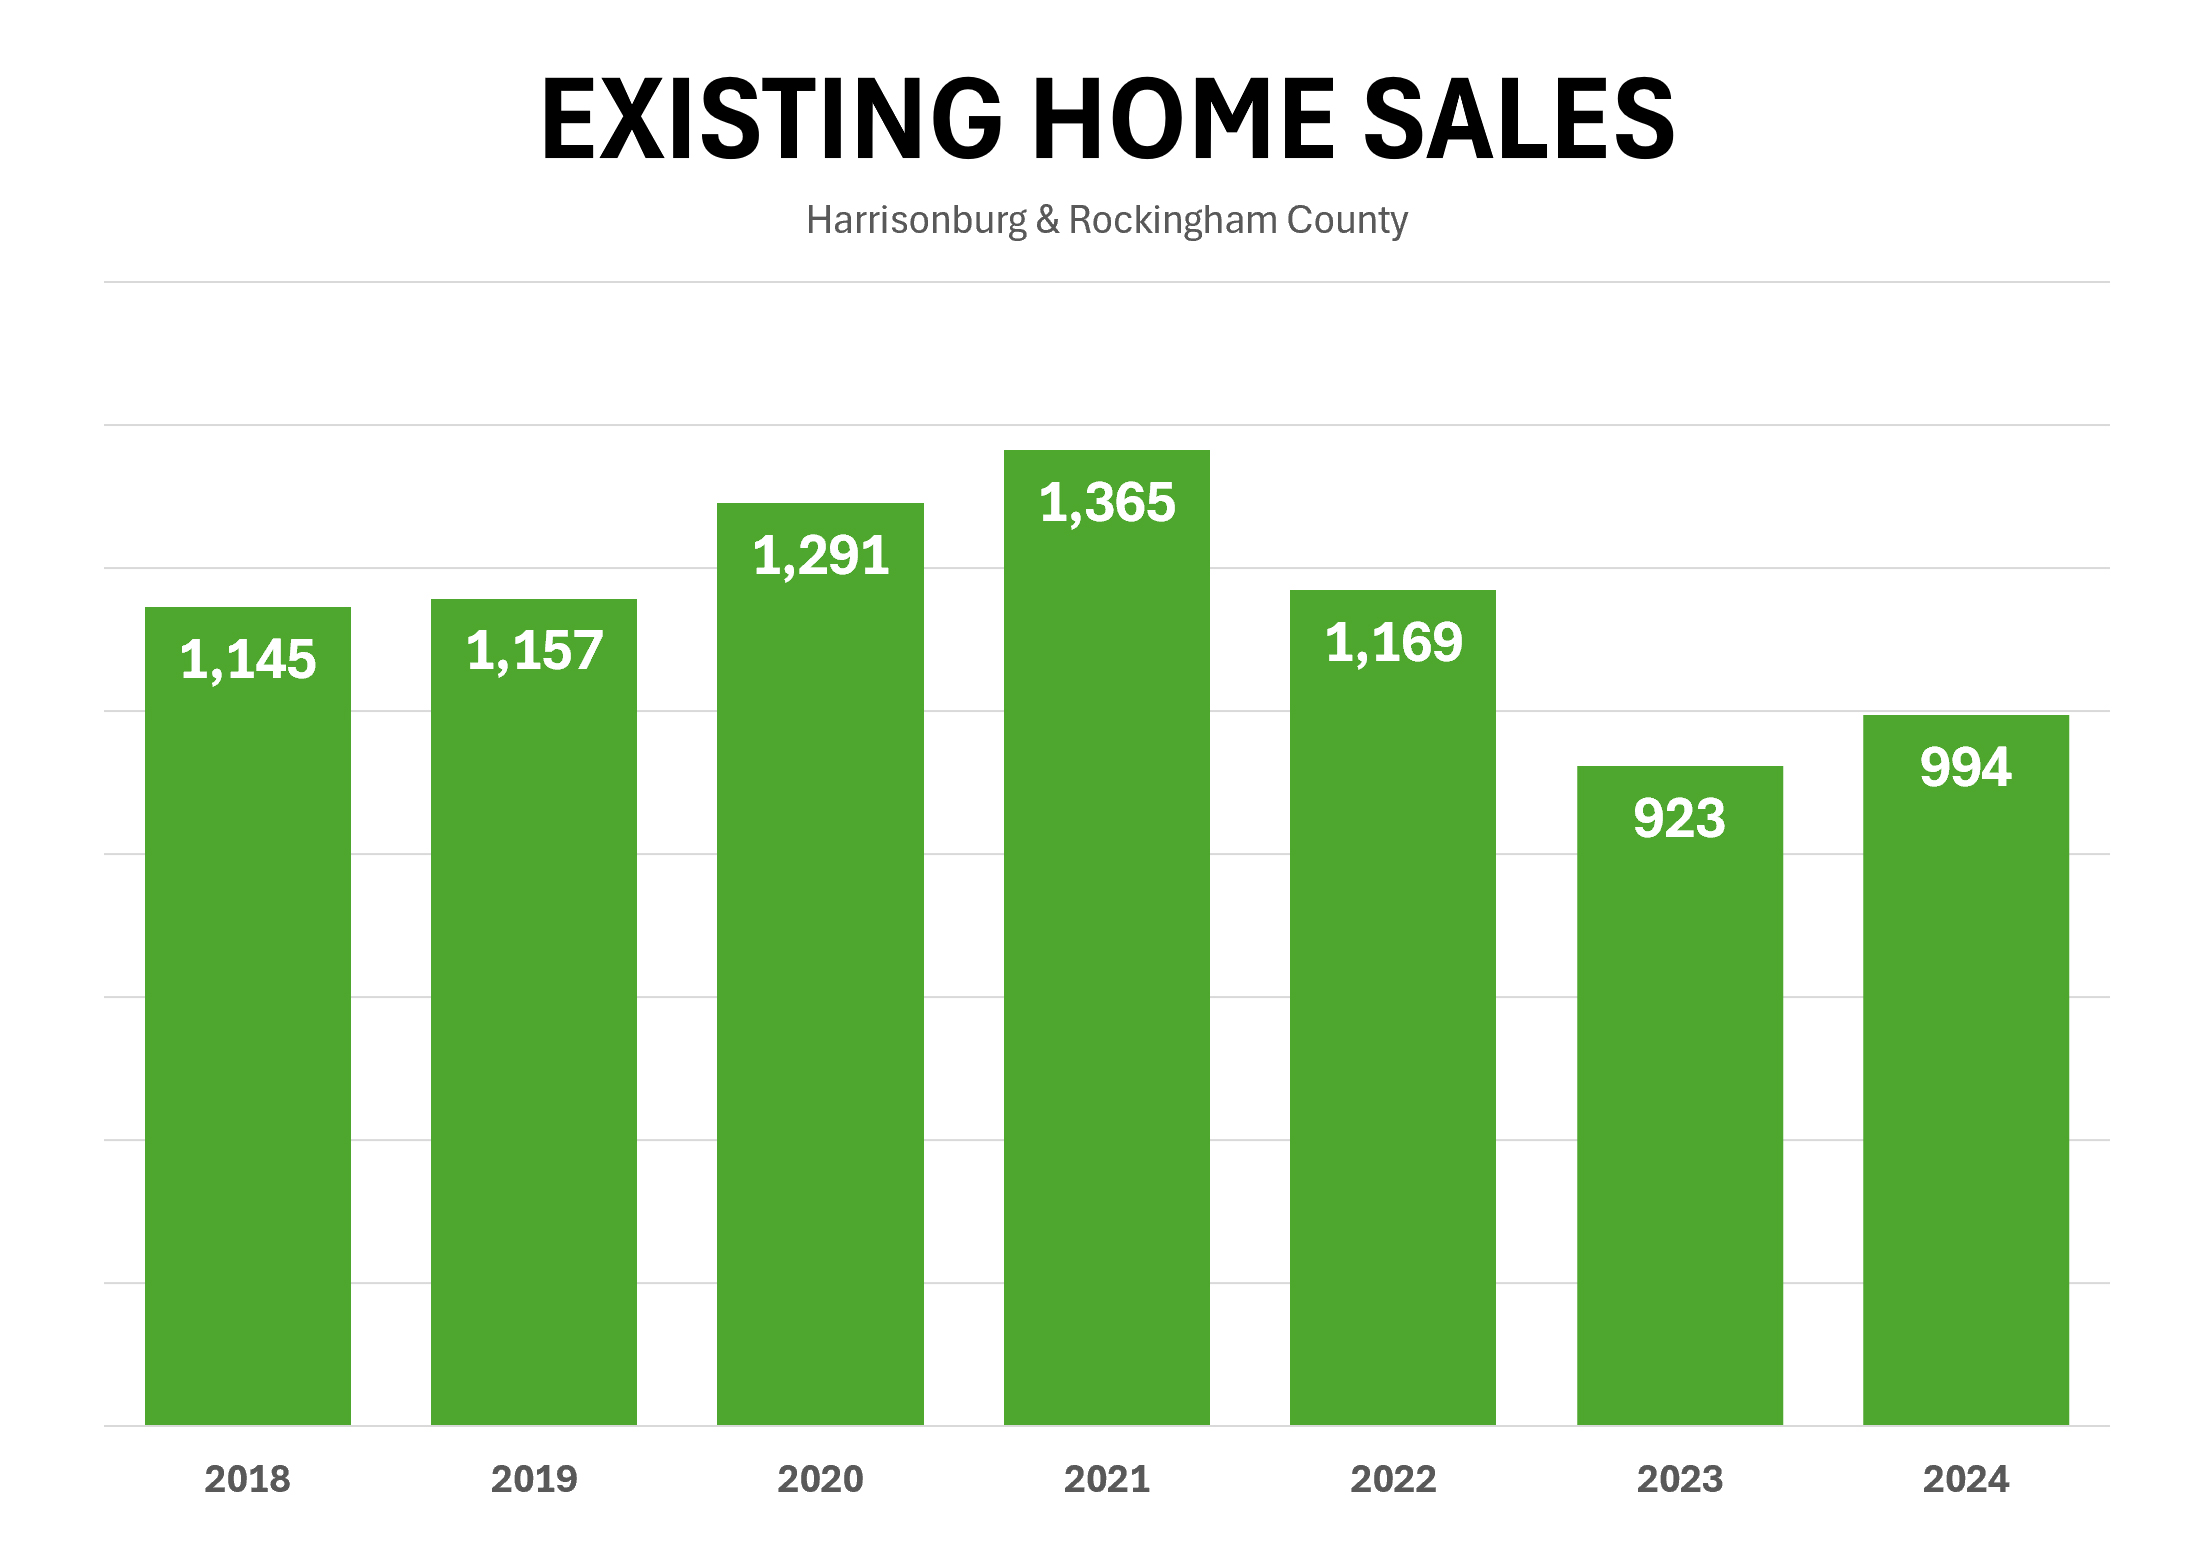
Most graphs I examine are looking at the total number of home sales in the Harrisonburg and Rockingham County. This graph is a bit different.
All of those other graphs include data that encompasses both resale homes and new homes. This graph examines only the number of existing homes that are selling.
We have been in a strong buyer's market since (at least) 2018... thus, the number of existing home sales per year...
1. Is showing us the number of buyers who bought and sellers who sold. :-)
2. Is not necessarily showing us how many buyers wanted to buy.
3. Is more reasonably interpreted as a view into how many sellers were willing to sell.
Between 2018 and 2022 we consistently saw more than 1,100 homeowners a year being willing to sell their homes.
Then, in 2023, that dropped to only 923 homeowners being willing to sell.
Thankfully, a slightly larger number of homeowners (994) were willing to sell in 2024.
Why did the number of homeowners who were willing to sell (turnover, if you will) drop so much in 2023? I think it is primarily a combination of two factors...
[1] Home prices feeling higher, ever higher, thanks to four years in a row of 10% annual increases in the median sales price.
[2] Mortgage interest rates climbing from 3% in early 2022 to 6% in early 2023.
So... higher than ever home prices and higher than anytime recently interest rates leaves many homeowners saying... yeah, I think I will choose NOT to sell my house this year.
And thus... the market has tightened for buyers. There are plenty of buyers waiting and wanting to buy resale homes, but they are at the mercy of how many homeowners will be willing to sell.
An early look at 2025 shows...
Jan + Feb 2025 = 115 existing home sales
...and in context...
Jan + Feb 2024 = 131 existing home sales
Oh darn. Maybe even FEWER existing homeowners will sell their homes in 2025!?!