Annual Home Sales In A Larger (Longer) Context

Scott P. Rogers
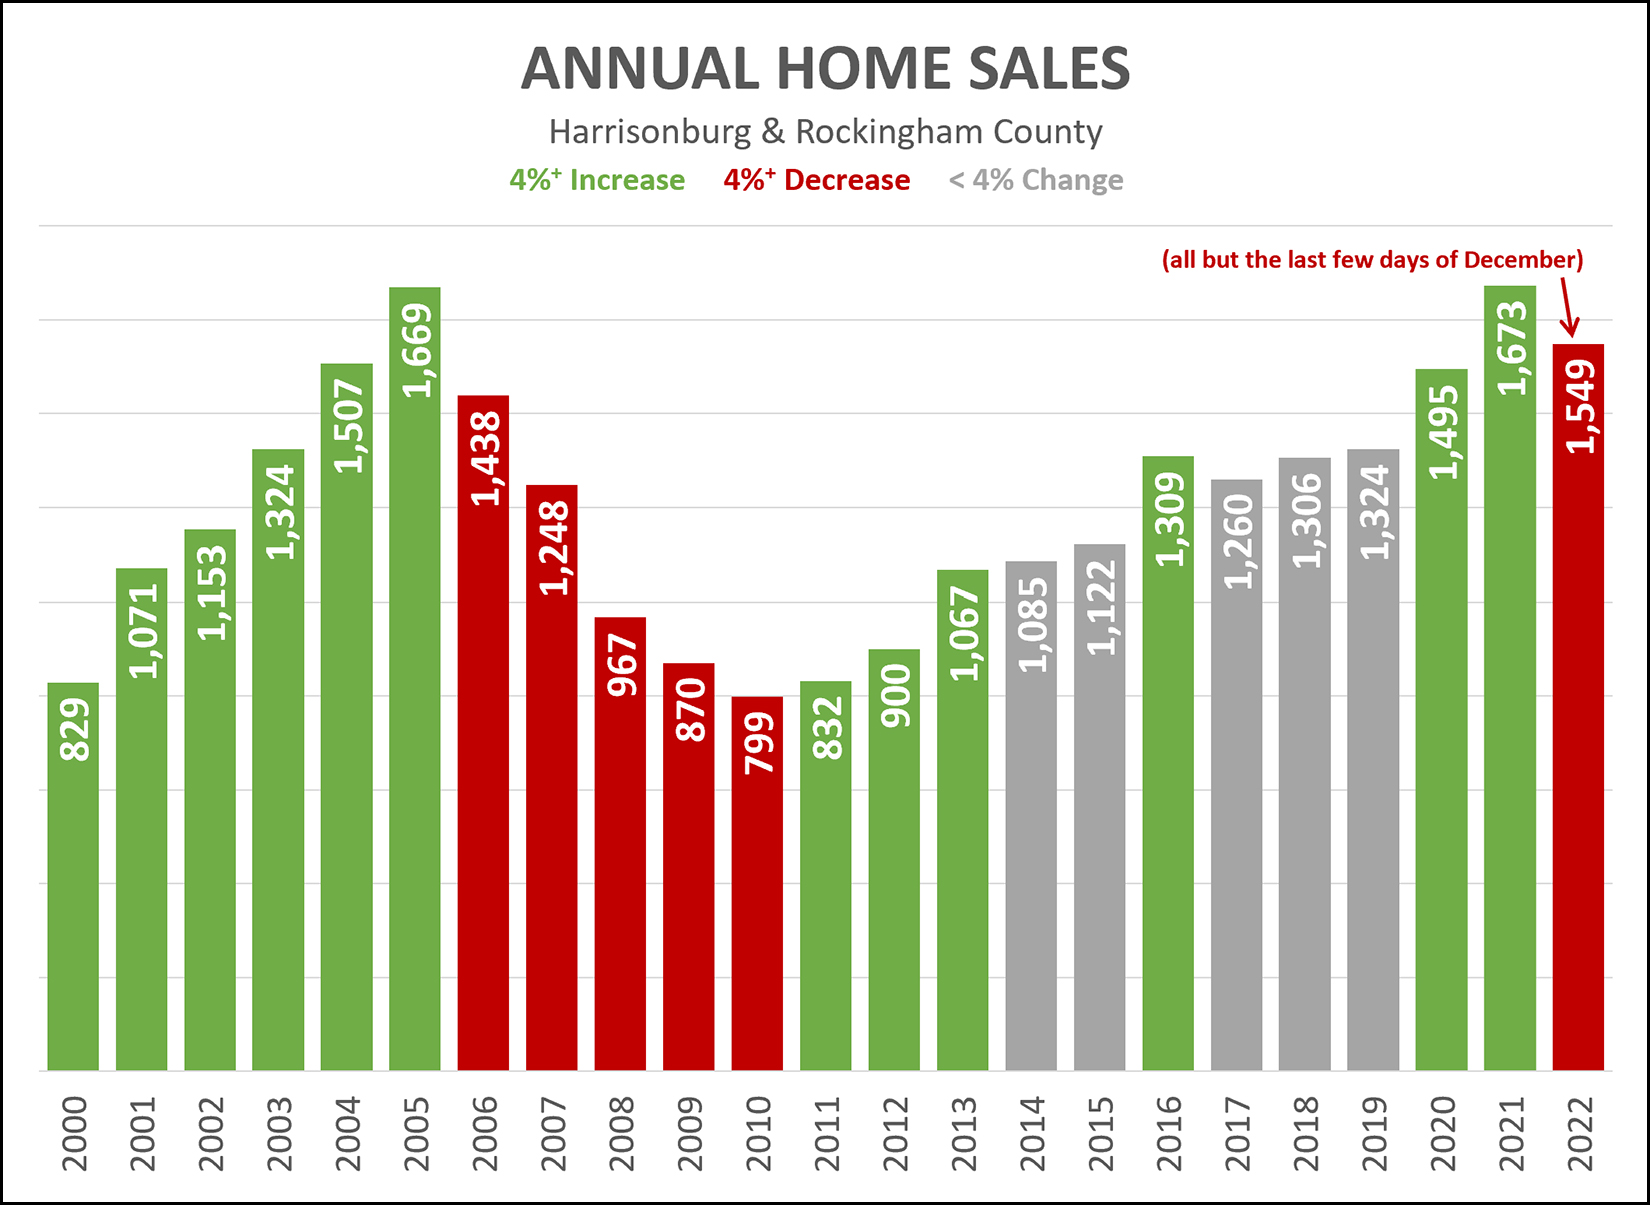
Even after the last few home sales of 2022 are tabulated, we'll see a net decline in the number of homes selling in 2022 as compared to 2021.
In the graph above I have each year color coded as follows...
GREEN = 4% or greater increase in # home sales
RED = 4% or greater decrease in # home sales
GREY = less than a 4% change in # home sales
Thus, as you can see, we've seen an increase in the pace of home sales in the local market, or less than a 4% change in the pace of home sales, every year since 2000 except for in 2006, 2007, 2008, 2009 and 2010... and now, 2022.
It's hard to say at this point what 2023 will look like, but it seems reasonable to think we may see another (+4%) decline in the numbers of homes selling in Harrisonburg and Rockingham County.