Annual Home Sales In A Larger (Longer) Context

Scott P. Rogers
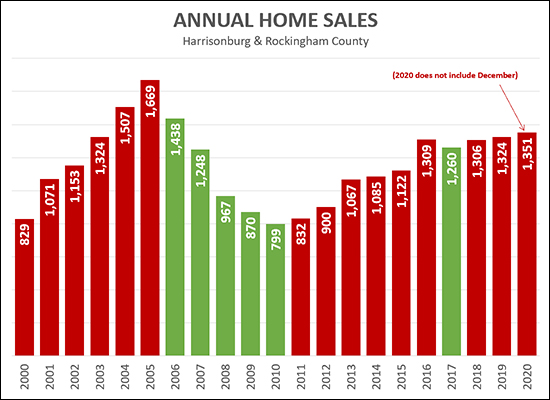
The graph above shows how many home sales took place each year for the past 20 years. The only incomplete data point is 2020 which only includes January through November home sales. When December home sales are in the books, we're likely to have seen 1400+ home sales this year.
A few observations...
- The likely 1400+ home sales in 2020 will be higher than any other year in the past 20 years other than 2004, 2005 and 2006.
- If we get to 1439 home sales, we will have beat every year except 2004 and 2005.
- Home sales increased year over year between 2000 and 2005, declined year over year between 2005 and 2010 and have been almost entirely increasing year over year ever since 2011!
As for next year -- I'll hold off on my predictions for a bit longer...