
Showings Strong in November after slower October

Scott P. Rogers
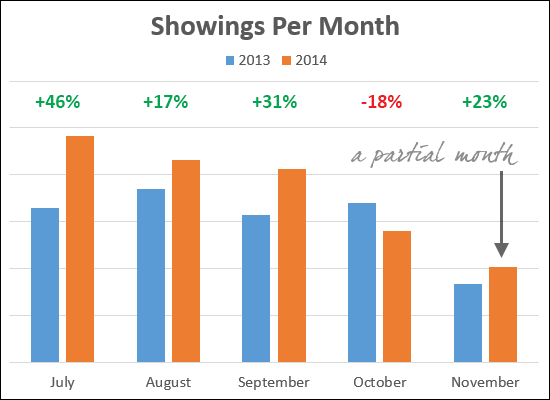
One measure of future performance of our local real estate market is how many homes are being viewed by buyers. The data above is an analysis of showings of Funkhouser Real Estate Group listings over the past several months.
A few things to note....
- Showing activity, in general, is up quite a bit this year, with double digit year over year increases in July, August and September.
- Showings slowed down in October (2014) for some reason, as compared to October 2013.
- The frantic pace is back in November -- as the blue November bar accounts for the entire month of November 2013, while the orange November bar only accounts for showings between Nov 1 and 16 this year.
- Aside from year over year increases, showings are starting to slow down as we head into Winter, as is typical.