
Housing recovery more evident in lower price ranges

Scott P. Rogers
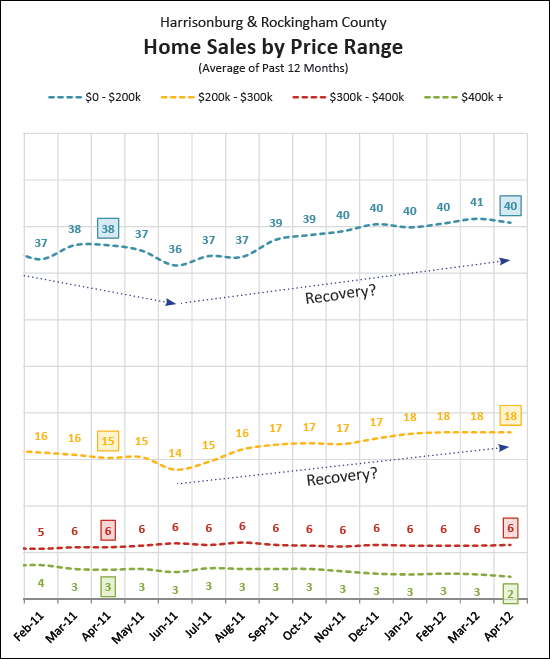
The graph above shows the average number of home sales per month (in each of four price ranges) when evaluating a 12-month time period. For example, the last data point shows the average number of home sales per month for May 2011 - April 2012.
As is quite evident, the recovery (in the pace of home sales) is more pronounced in the lower price ranges.