Was 2011 "the new normal" for the pace of home sales in Harrisonburg and Rockingham County?

Scott P. Rogers
In 2000, there were 829 home sales. That zoomed up to 1,669 in 2005. This past year (2011) there were 791 home sales. Certainly, 1,669 home sales a year is not a normal pace of home sales, but is 791 home sales per year a reasonable assumption for the pace of our local housing market going forward?
To explore this issue, I have created a model showing what home sales would have been if a constant percentage of our local population bought a home each year, and I have included population increases from the past decade.
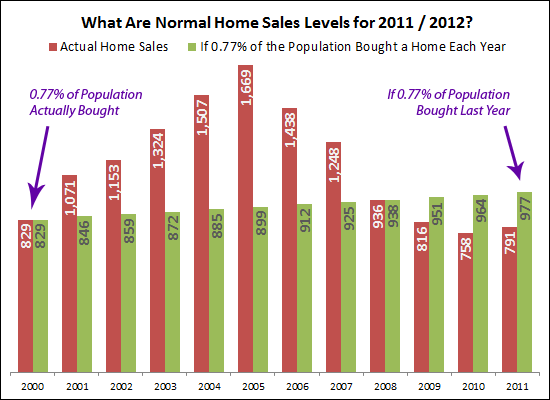
Above you'll note that in 2000, a total of 0.77% of the population purchased a home (829). Then, for each following year, I have shown how many people would have bought a home if it continued to be 0.77% of the total population. Per these calculations, home sales in 2011 (though improved over 2010) are still well below where they (theoretically) should be. If 0.77% of the population bought in 2011, home sales would have been 23% higher than they were last year.
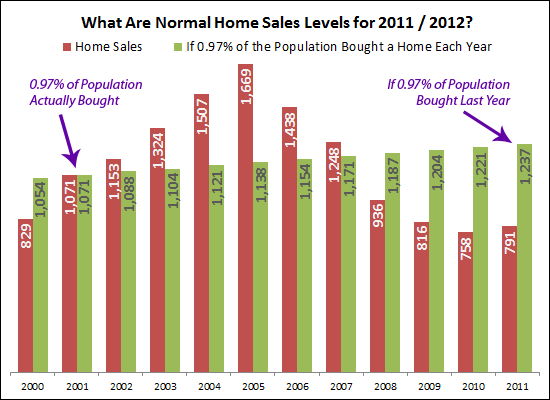
Above is a second illustration, assuming that 2011 was a normal year -- and that each year we should expect 0.97% of the population to buy a home. In this scenario, home sales should have been 56% higher last year to have 0.97% of the population buy a home.
Regardless of the actual numbers, my conclusion based on the data above is that 791 home sales per year (as in 2011) is not the new normal for our market. I believe the market will improve further as to the annual pace of home sales -- at least to 1,000 sales per year.
To explore this issue, I have created a model showing what home sales would have been if a constant percentage of our local population bought a home each year, and I have included population increases from the past decade.
Above you'll note that in 2000, a total of 0.77% of the population purchased a home (829). Then, for each following year, I have shown how many people would have bought a home if it continued to be 0.77% of the total population. Per these calculations, home sales in 2011 (though improved over 2010) are still well below where they (theoretically) should be. If 0.77% of the population bought in 2011, home sales would have been 23% higher than they were last year.
Above is a second illustration, assuming that 2011 was a normal year -- and that each year we should expect 0.97% of the population to buy a home. In this scenario, home sales should have been 56% higher last year to have 0.97% of the population buy a home.
Regardless of the actual numbers, my conclusion based on the data above is that 791 home sales per year (as in 2011) is not the new normal for our market. I believe the market will improve further as to the annual pace of home sales -- at least to 1,000 sales per year.