Buy A Home, While Supplies Last!

Scott P. Rogers
OK --- perhaps that wasn't the most fitting title --- supply continues to be very high in several price ranges in Harrisonburg and Rockingham County.
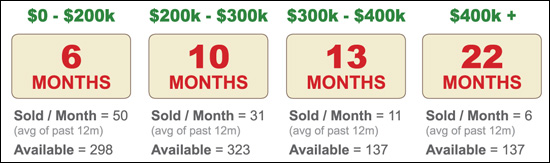
The graphic above is an illustration of the relationship between our market's supply and demand in four price ranges.
The numbers (6, 10, 13, 22) represent the months of supply of properties currently available based on average demand per month in each price range, during the past twelve months.
Source: Harrisonburg/Rockingham Association of Realtors
The graphic above is an illustration of the relationship between our market's supply and demand in four price ranges.
The numbers (6, 10, 13, 22) represent the months of supply of properties currently available based on average demand per month in each price range, during the past twelve months.
Source: Harrisonburg/Rockingham Association of Realtors