Brought to you by Scott P. Rogers, Funkhouser Real Estate Group, 540-578-0102, scott@HarrisonburgHousingToday.com
Brought to you by Scott P. Rogers, Funkhouser Real Estate Group, 540-578-0102, scott@HarrisonburgHousingToday.com
Thursday, August 14, 2025
Happy Thursday morning, friends!
Despite only being halfway through August, summer is winding down and many local students and teachers are getting ready for a new school year. Luke will be starting his third year of college this year, and Emily is beginning her senior year of high school. The years fly by quickly!
I hope you and your family had a delightful, fun, adventurous and yet relaxing summer. We closed out the summer with some fun at the lake, including waterskiing, tubing, wakesurfing and wakeboarding. When I was growing up, waterskiing was the focus, but I have enjoyed seeing Luke and Emily branch out and learn these new (to me) water sports. But, yeah, I'll stick to waterskiing. :-)

Now, three quick notes before we dive into the latest trends in our local real housing market...
[1] Monthly Giveaway
Each month I offer a giveaway to the readers of my market report to highlight a local business, dining establishment, musical event or organization. This month, I'm giving away two tickets to the Great Valley Baking Challenge hosted by Adagio House.
Adagio House is a local non-profit that works to ensure families experiencing disability are cared for, included, and valued members of our communities. Shaena and Luke both serve on the board of Adagio House and will be competing in the third annual Great Valley Baking Challenge, taking place on Sunday, September 21 at 2PM at Bluestone Vineyard.
Click here for a chance to win a pair of tickets to the Great Valley Baking Challenge, or buy tickets for yourself or friends here.
[2] Daily Real Estate Musings
You can learn more about our housing market, and the home buying and selling process in general by reading my daily (M-F) email newsletter. Recent topics have included...
Check out my daily newsletter over at Harrisonburg Housing Today, or subscribe to receive it each day by email.
[3] Ready To Get Started?
If you will be selling your house soon, or if you are starting to consider a home purchase, I'd be delighted to help you with the process. Reach out anytime by phone/text at 540-578-0102 or by email.
Now, let's take a look at some of the latest data and trends in our local housing market!
First up, looking at all home sales in Harrisonburg & Rockingham County...
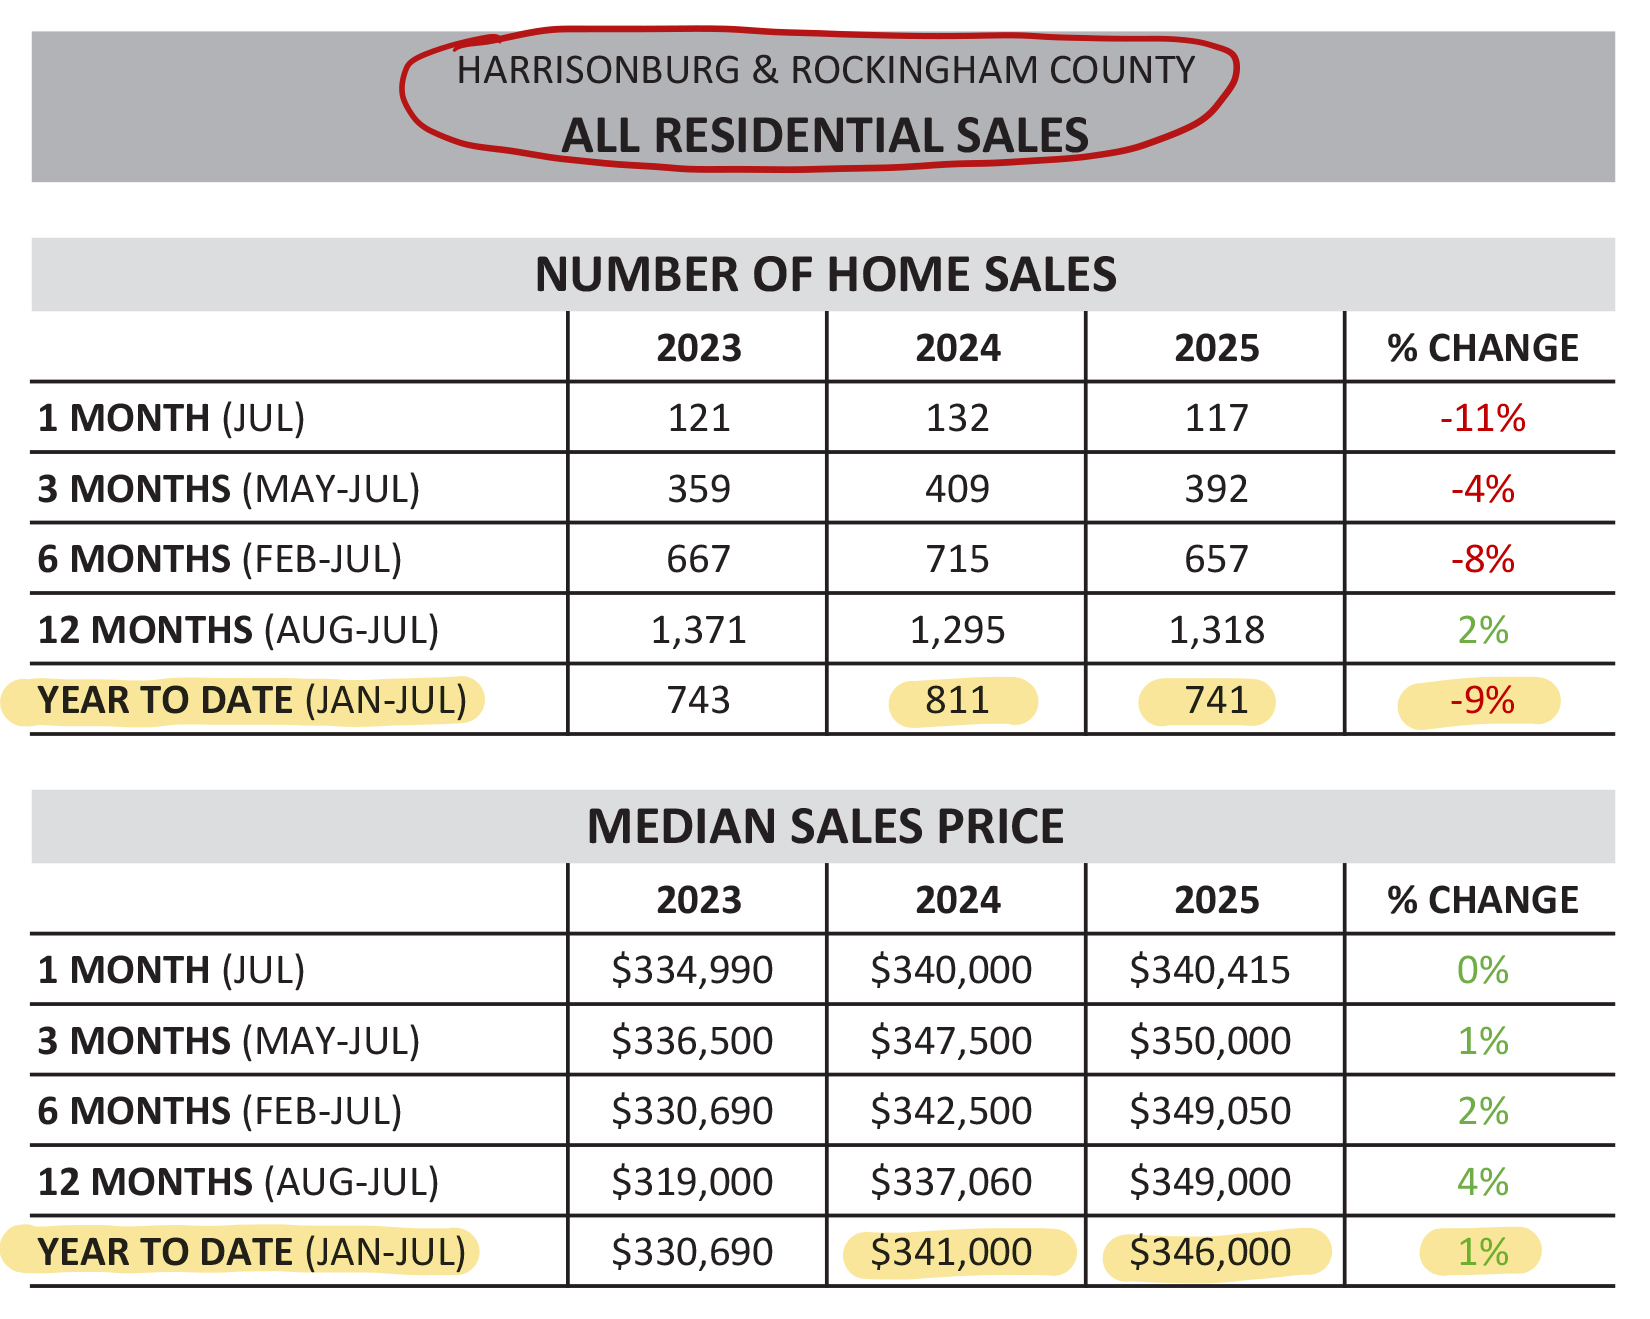
The top half of the chart above illustrates the number of homes sold in our local market. From January through July 2025, we've seen 741 home sales -- down 9% compared to the same period last year.
Also in the chart above, you’ll notice that the median sales price has only risen slightly over the past year -- up just 1%, from $341,000 to $346,000.
These two trends -- fewer home sales and only a slight increase in sales prices -- show up consistently across most of the charts and graphs I'll be showing you this month. This modest 1% price increase is notably smaller than we've seen in recent years and also falls below the long-term historical average.
Now, let's take a look just at detached (single family) homes...
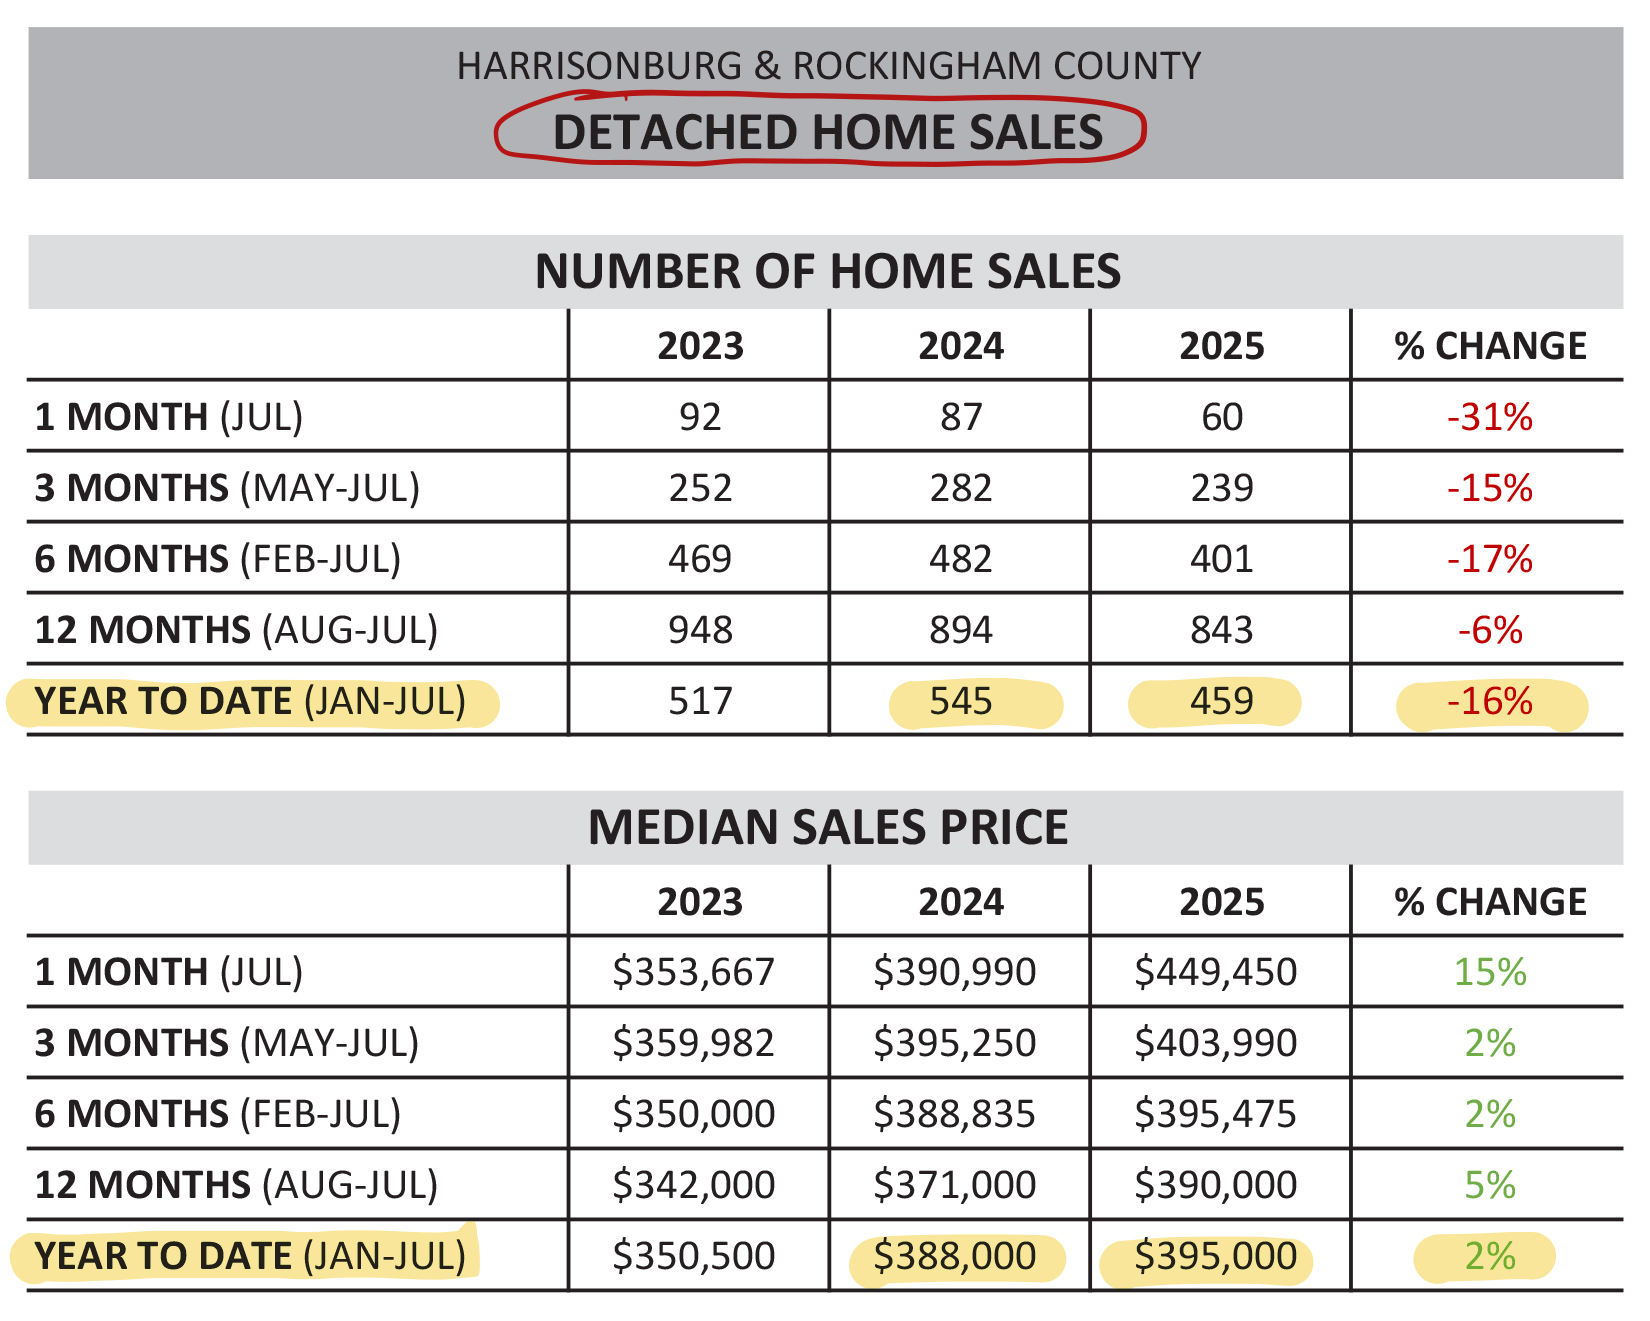
The decline in home sales is even more significant when we focus solely on detached homes. Excluding duplexes, townhomes, and condos, there have been 16% fewer detached home sales this year compared to the same period last year.
Detached homes have seen a slightly higher increase in median sales price-- 2% compared to the overall 1% -- but this remains well below the annual price growth we've seen in recent years.
And how about those attached homes? This includes duplexes, townhomes and condo sales...
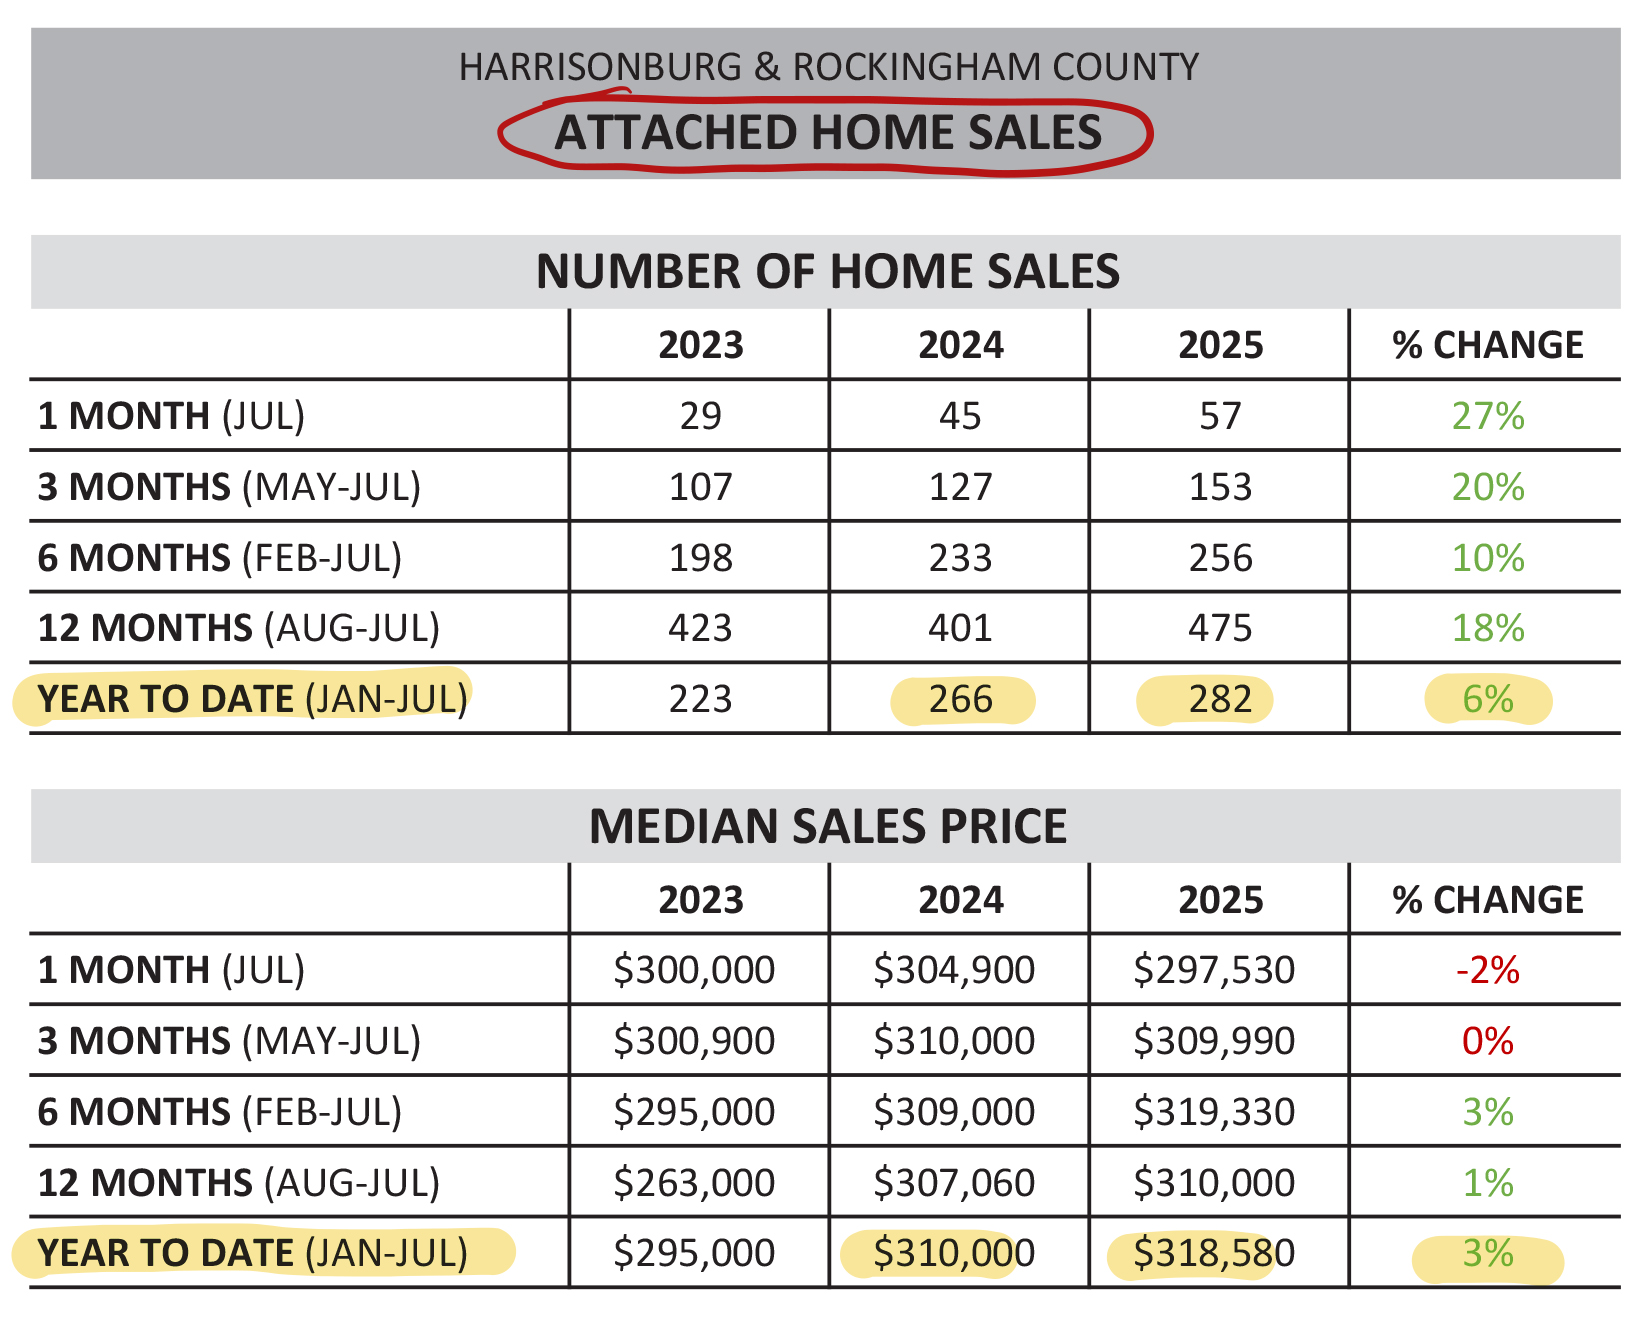
We're seeing a slight uptick (+6%) in attached home sales this year, with 282 sales compared to 266 during the same period last year. The median sales price for these homes has also increased slightly -- rising 3% to $318,580.
In contrast to this increase in attached home sales, we continue to see further declines in the number of homes that are selling in the City of Harrisonburg...
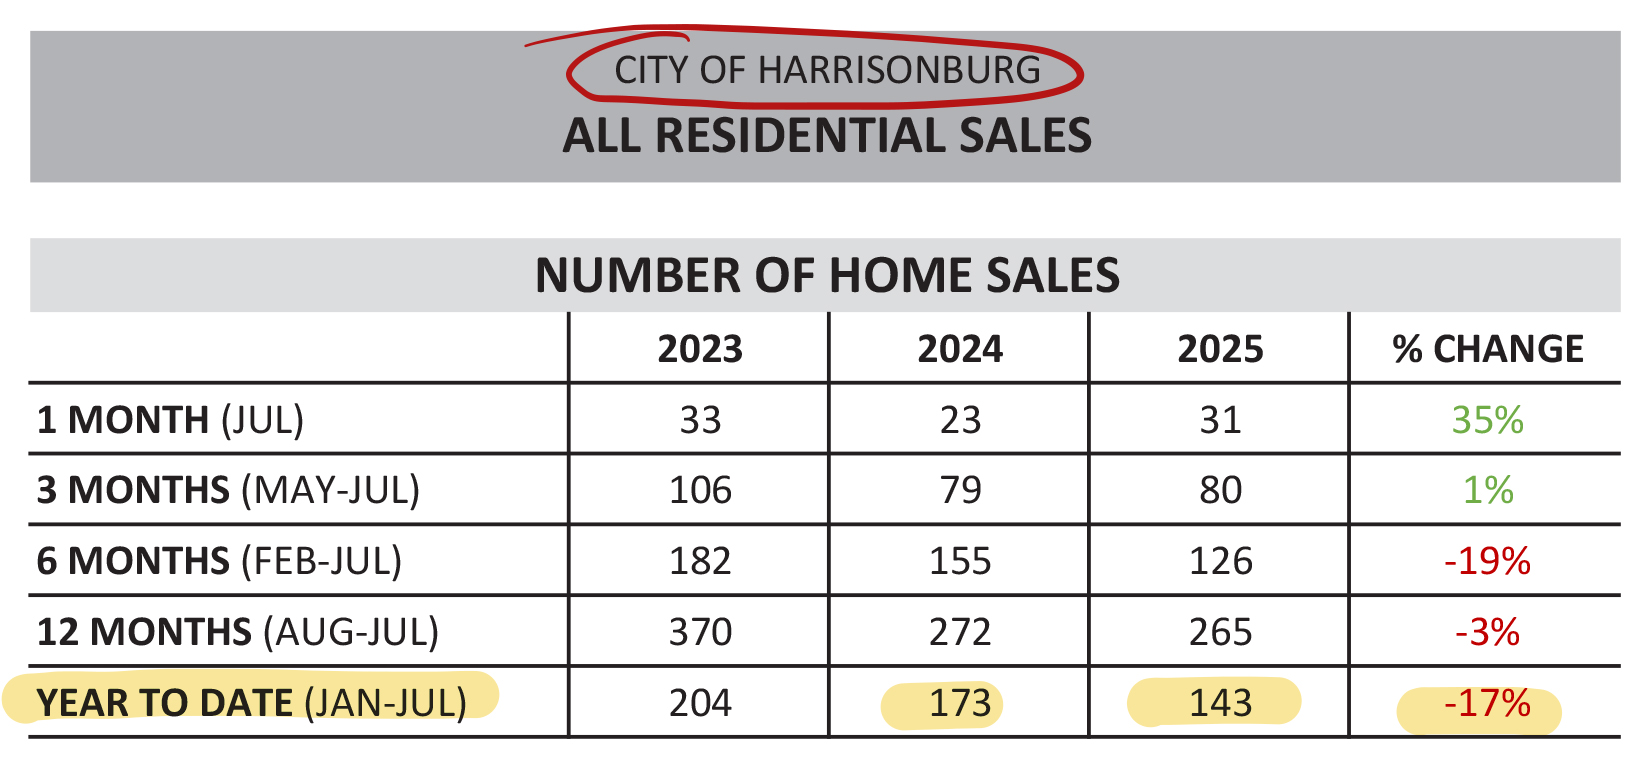
It's been tough to find a home to buy in the City of Harrisonburg. Two years ago there were 204 home sales between January and July. That dropped to 173 last year, and only 143 this year. The 17% decline in home sales over the past year has made it challenging for home buyers who hope to be in, stay in or move to the City.
Meanwhile, in Rockingham County...
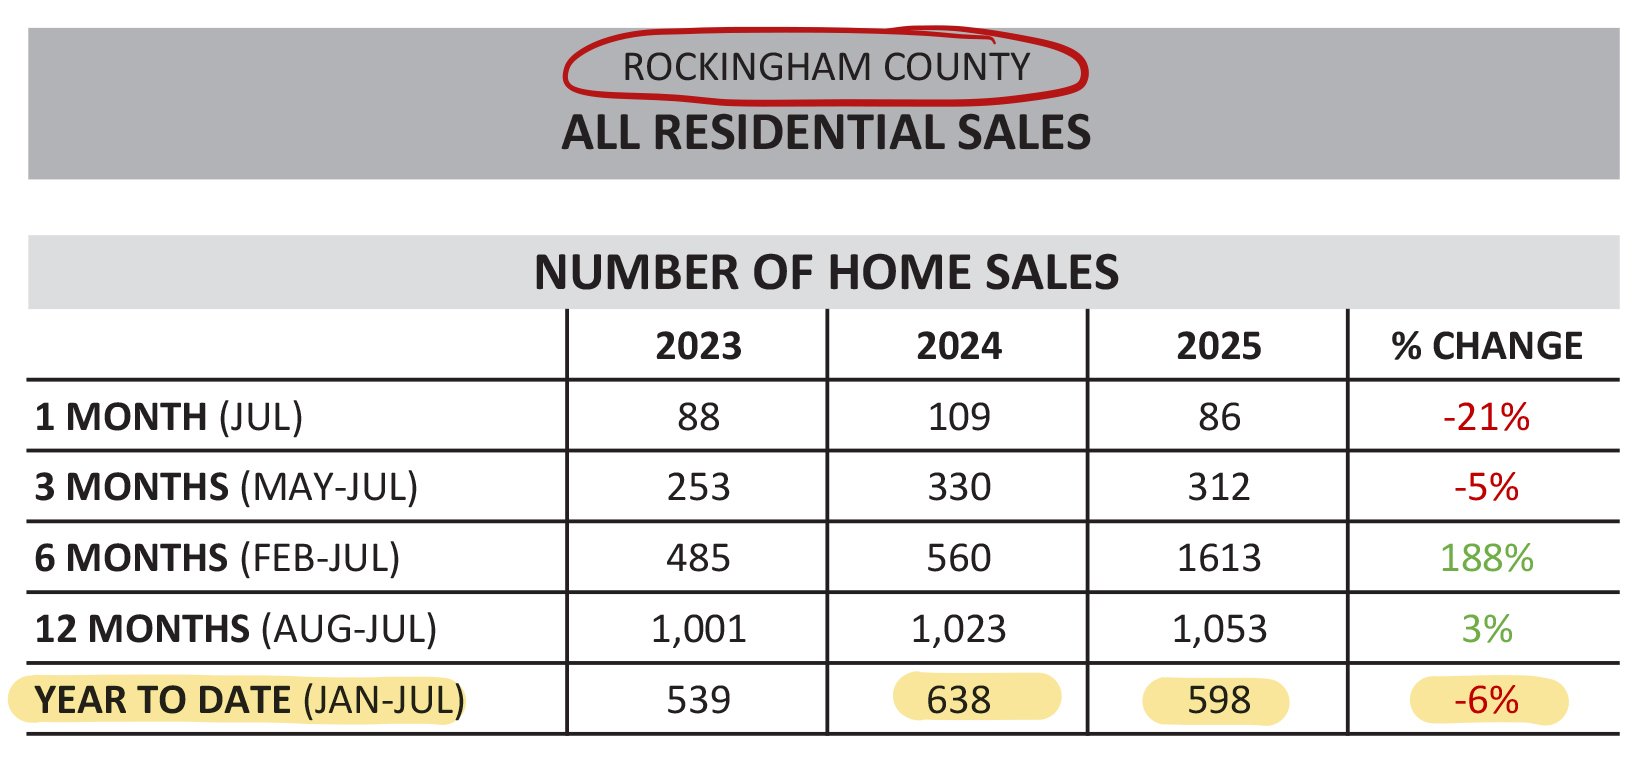
We're seeing a decline in home sales (-6%) in the County as well... but it is not nearly as significant as the drop off in the City. In fact, if we ignore 2024, we're seeing more home sales this year than in 2022 in the County... which is not a trend seen in the City.
Now, moving on past the charts, let's take a look at a few graphs that help tell the story of our local housing market...
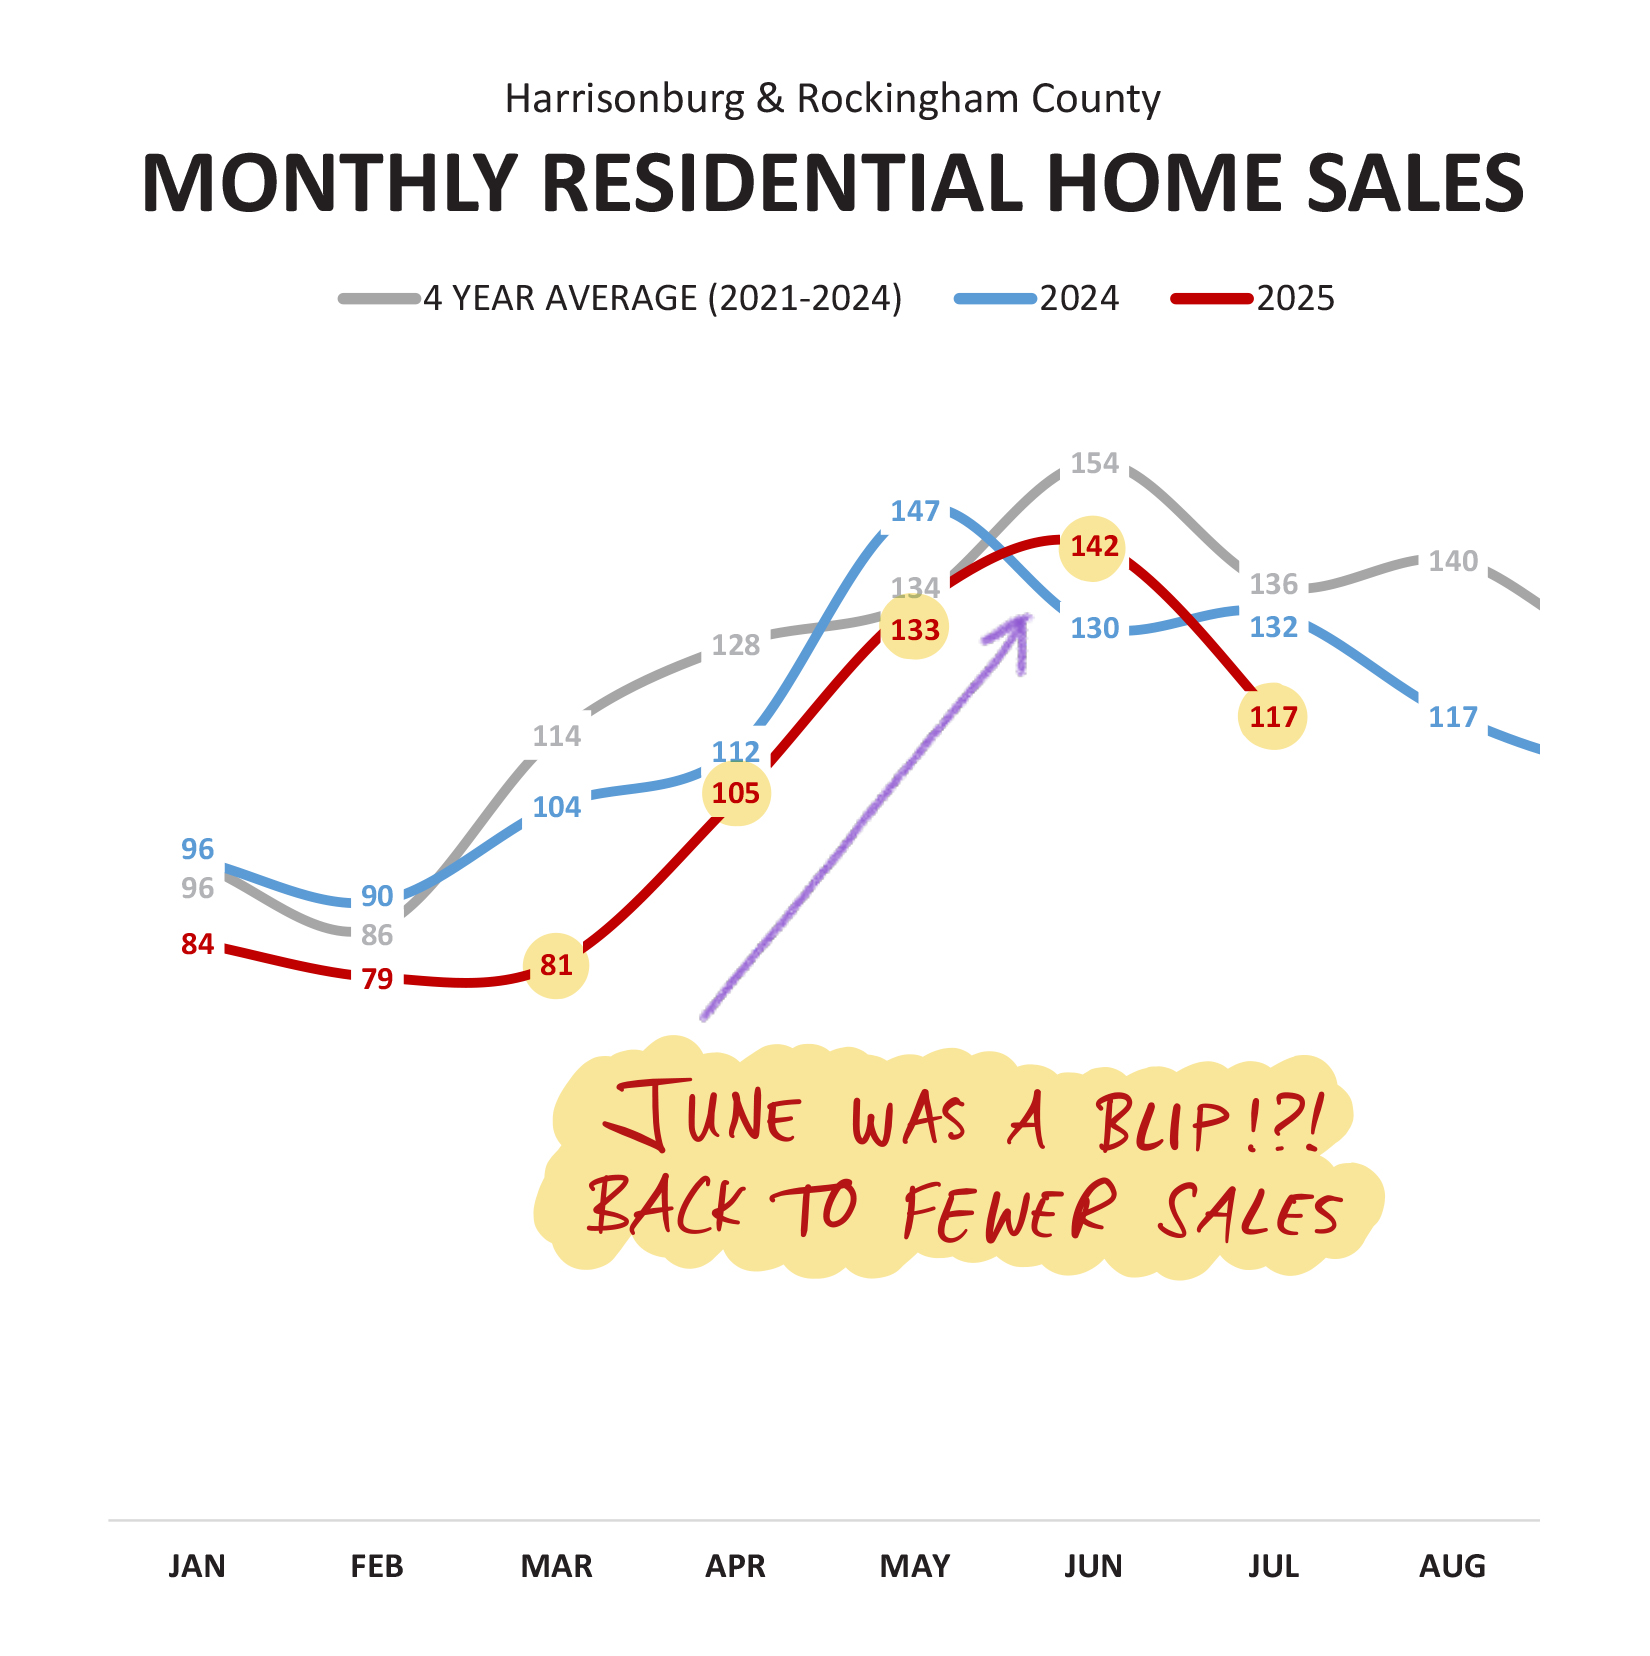
It seems June 2025 was an outlier.
JAN = fewer sales in 2025 than 2024
FEB = fewer sales in 2025 than 2024
MAR = fewer sales in 2025 than 2024
APR = fewer sales in 2025 than 2024
MAY = fewer sales in 2025 than 2024
JUN = MORE SALES IN 2025 THAN 2024
JUL = fewer sales in 2025 than 2024
Indeed, we have seen fewer home sales per month this year compared to last year... other than in June. A month ago I was thinking perhaps this was a sign that the market was starting to pick back up. Now, that is not as strong of a theory... though there were a lot of contracts signed in July. More on that later.
Given six out of seven months of slower home sales in 2025 than 2024, this stacked bar graph should not surprise you...

After a sharp drop in annual home sales from 2022 to 2023, the increase in sales during 2024 made it seem like the market was picking up again. But... not so fast. Based on current trends, it appears 2025 home sales may end up closer to 2023 levels, rather than continuing the upward momentum we saw in 2024.
This next graph shows a rolling 12-month view of data, providing a clearer look at long-term trends by smoothing out short-term fluctuations...
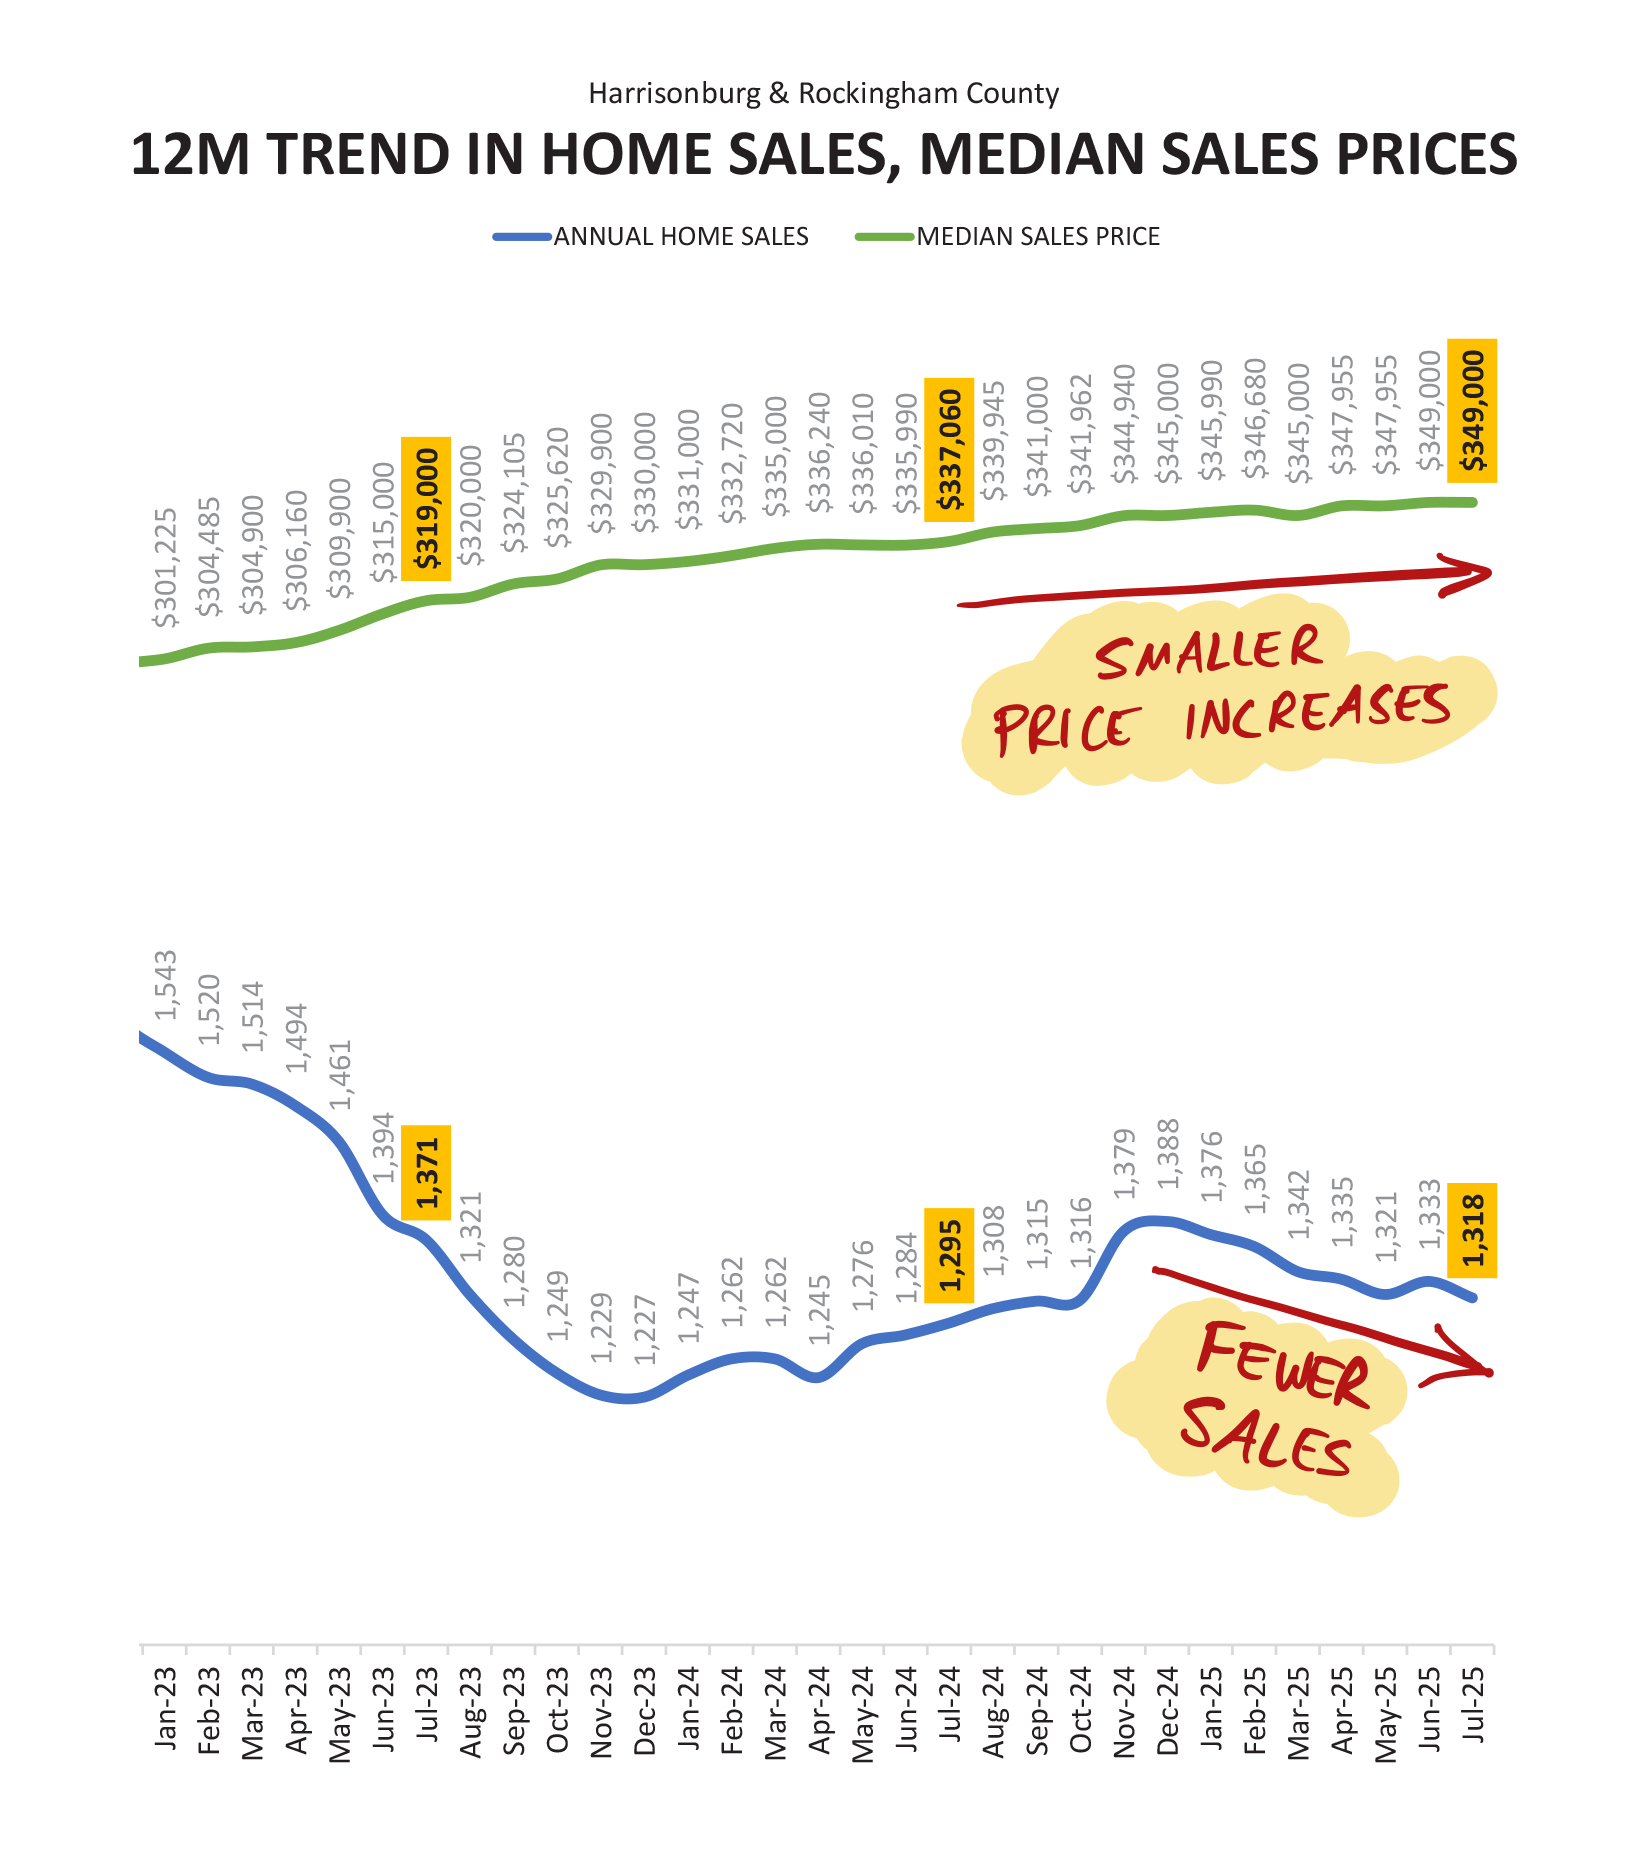
Two key trends stand out to me above... first, home prices are increasing at a much slower pace than in recent years; and second, the number of annual home sales continues to decline.
Here's a better look at the much smaller increases in the median sales price...
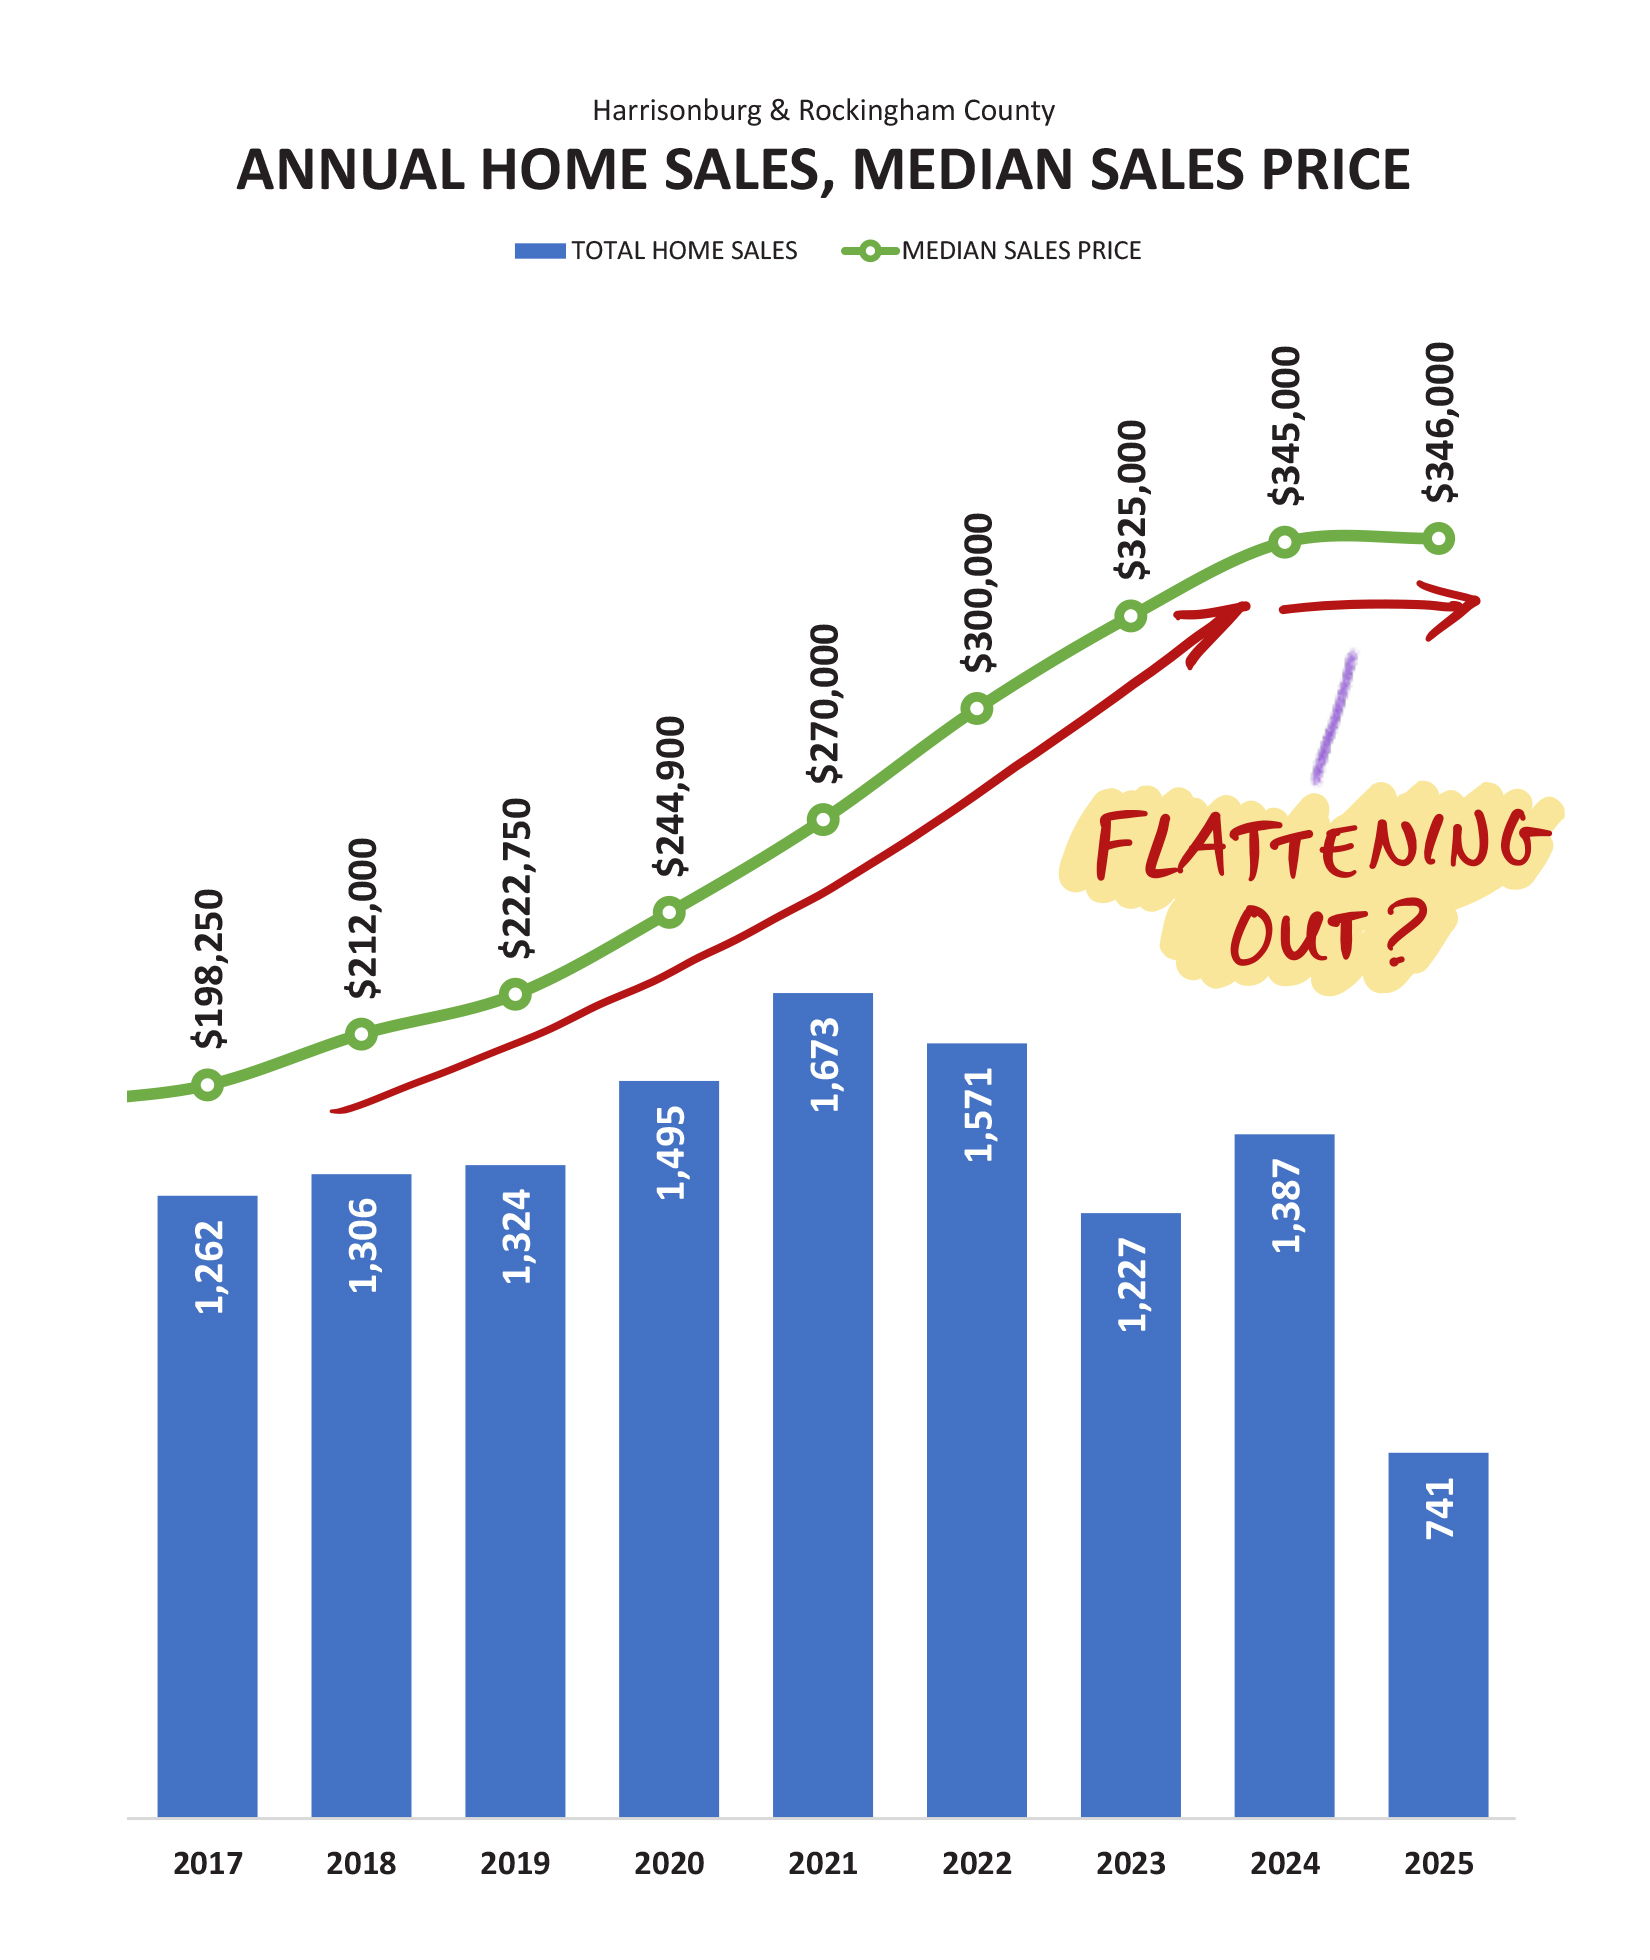
Words aren't really needed to explain what is shown above... but I'll add some anyhow... the median sales price rose steadily and quickly for seven years (2018-2024) but is now not really increasing at all. The median price in 2025 is only $1,000 higher (less than 1%) higher than it was a year ago. More on this later.
Here's a look at monthly contract activity... measuring how many buyers (and sellers) sign contracts each month...
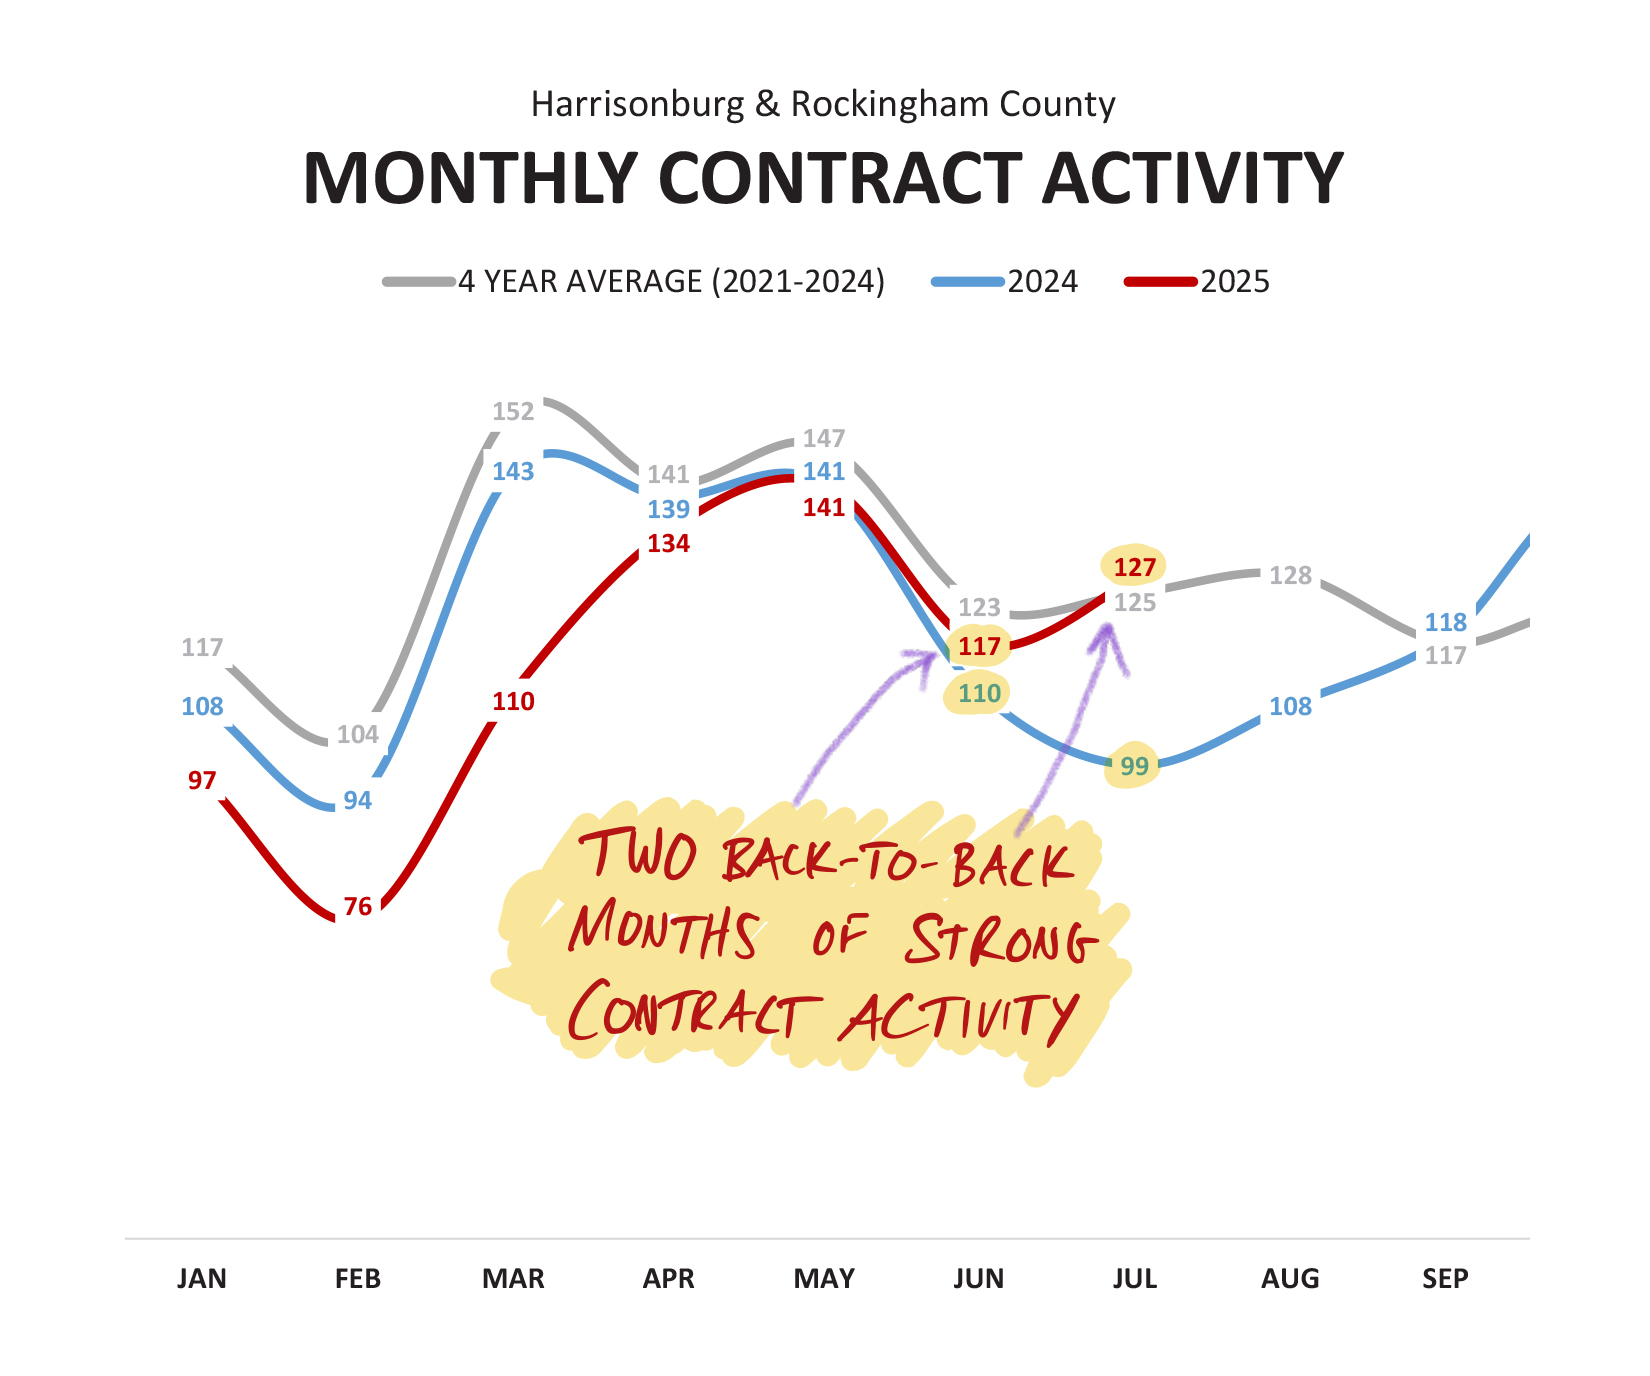
Despite seeing a 9% decline in home sales in 2025 compared to 2024... we have started to see more contract activity over the past two months. The 244 contracts (117+127) in June and July of this year is 16% higher than the 209 contracts (110+99) signed last June and July. Will this lead to more home sales in August and September this year than last? Possibly. Stay tuned.
As further evidence of a possible slight uptick in sales activity, take a look at pending sales trends...
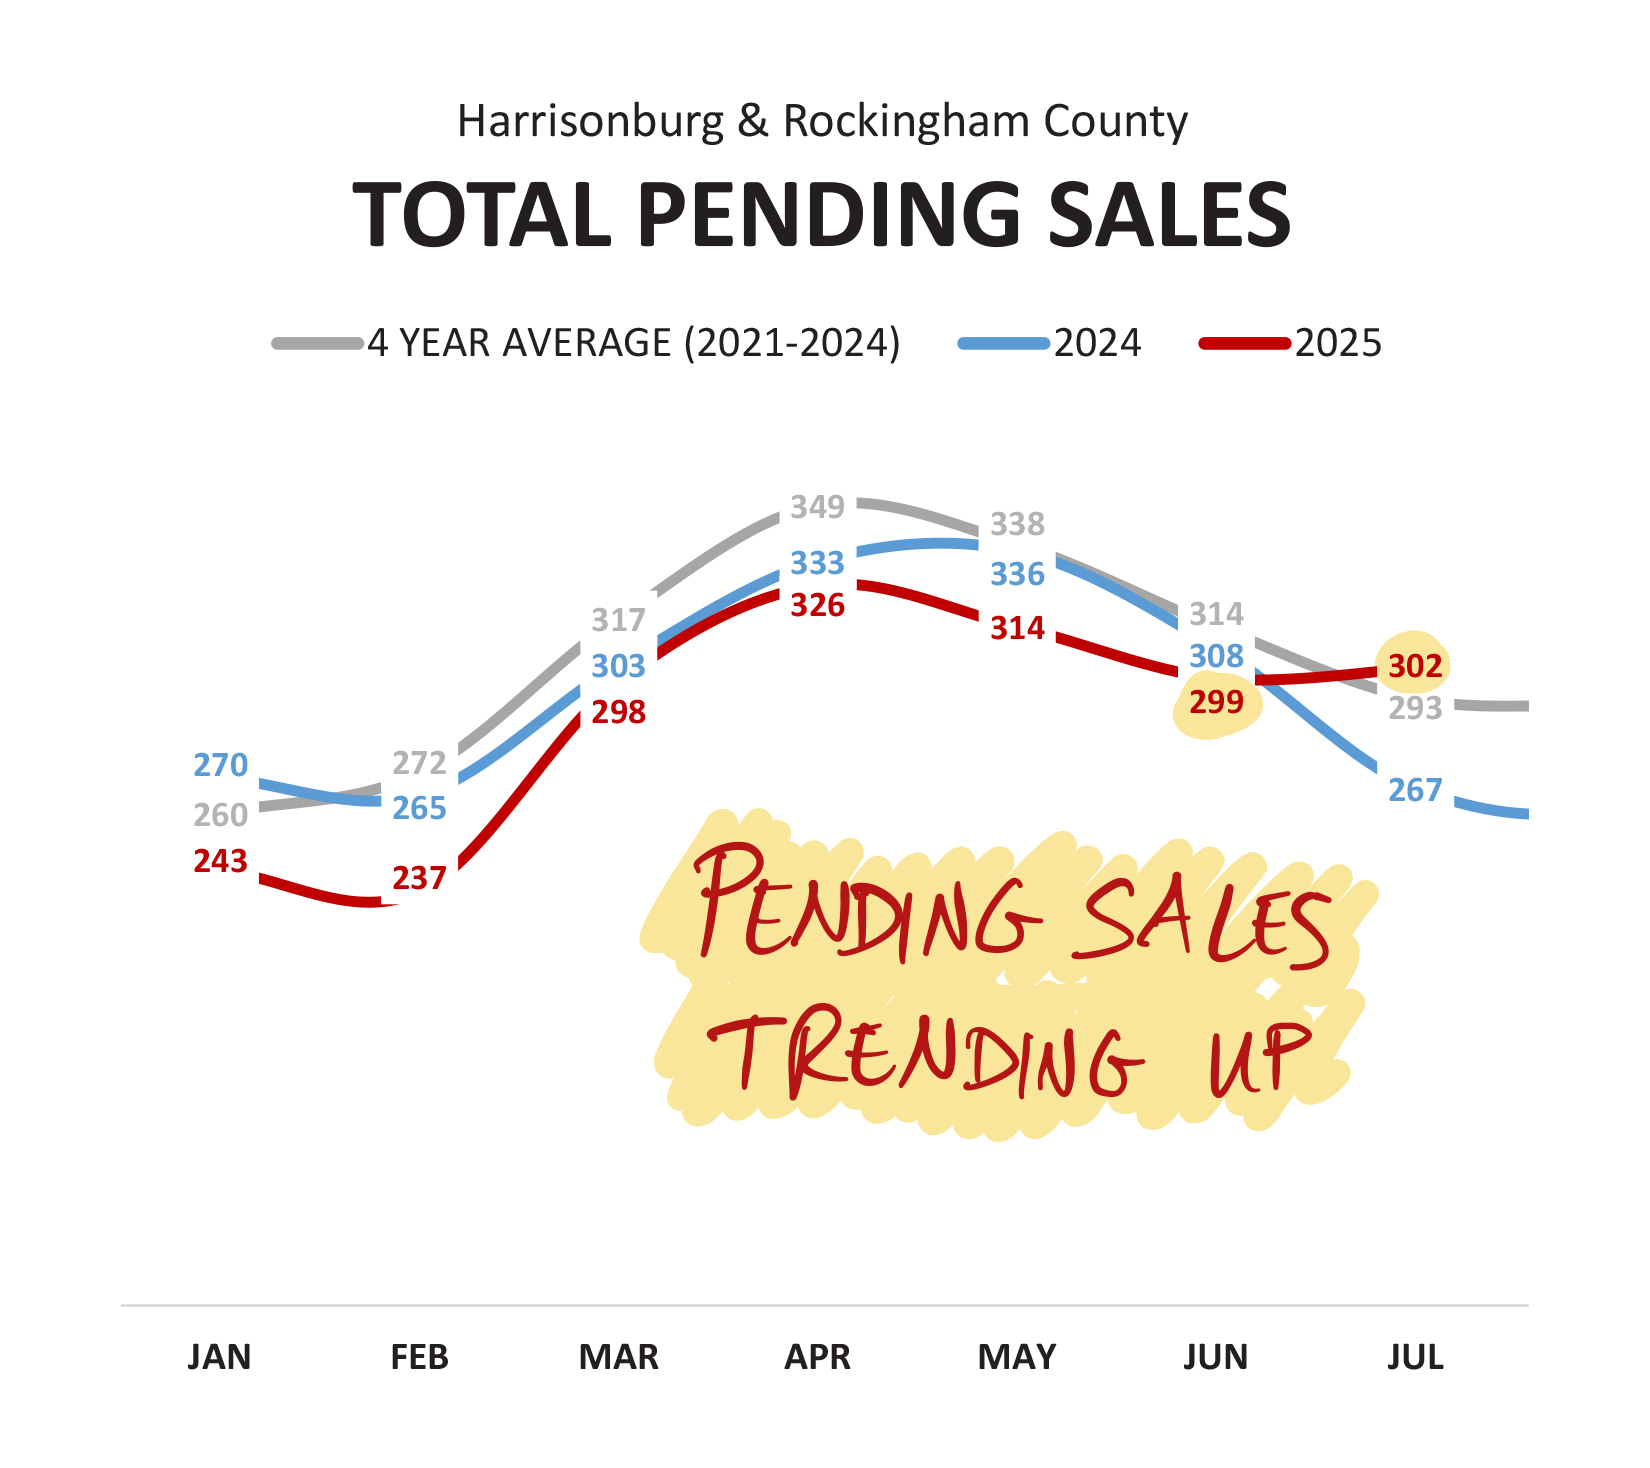
Pending sales measure the number of homes that are pending (under contract) at any given time. A year ago there were 267 homes under contract in Harrisonburg and Rockingham County... today there are 302 homes under contract. If this pending sales figure continues to stay above 2024 levels, we should start to see a year over year increase in home sales activity.
But... what else is rising? Inventory levels...
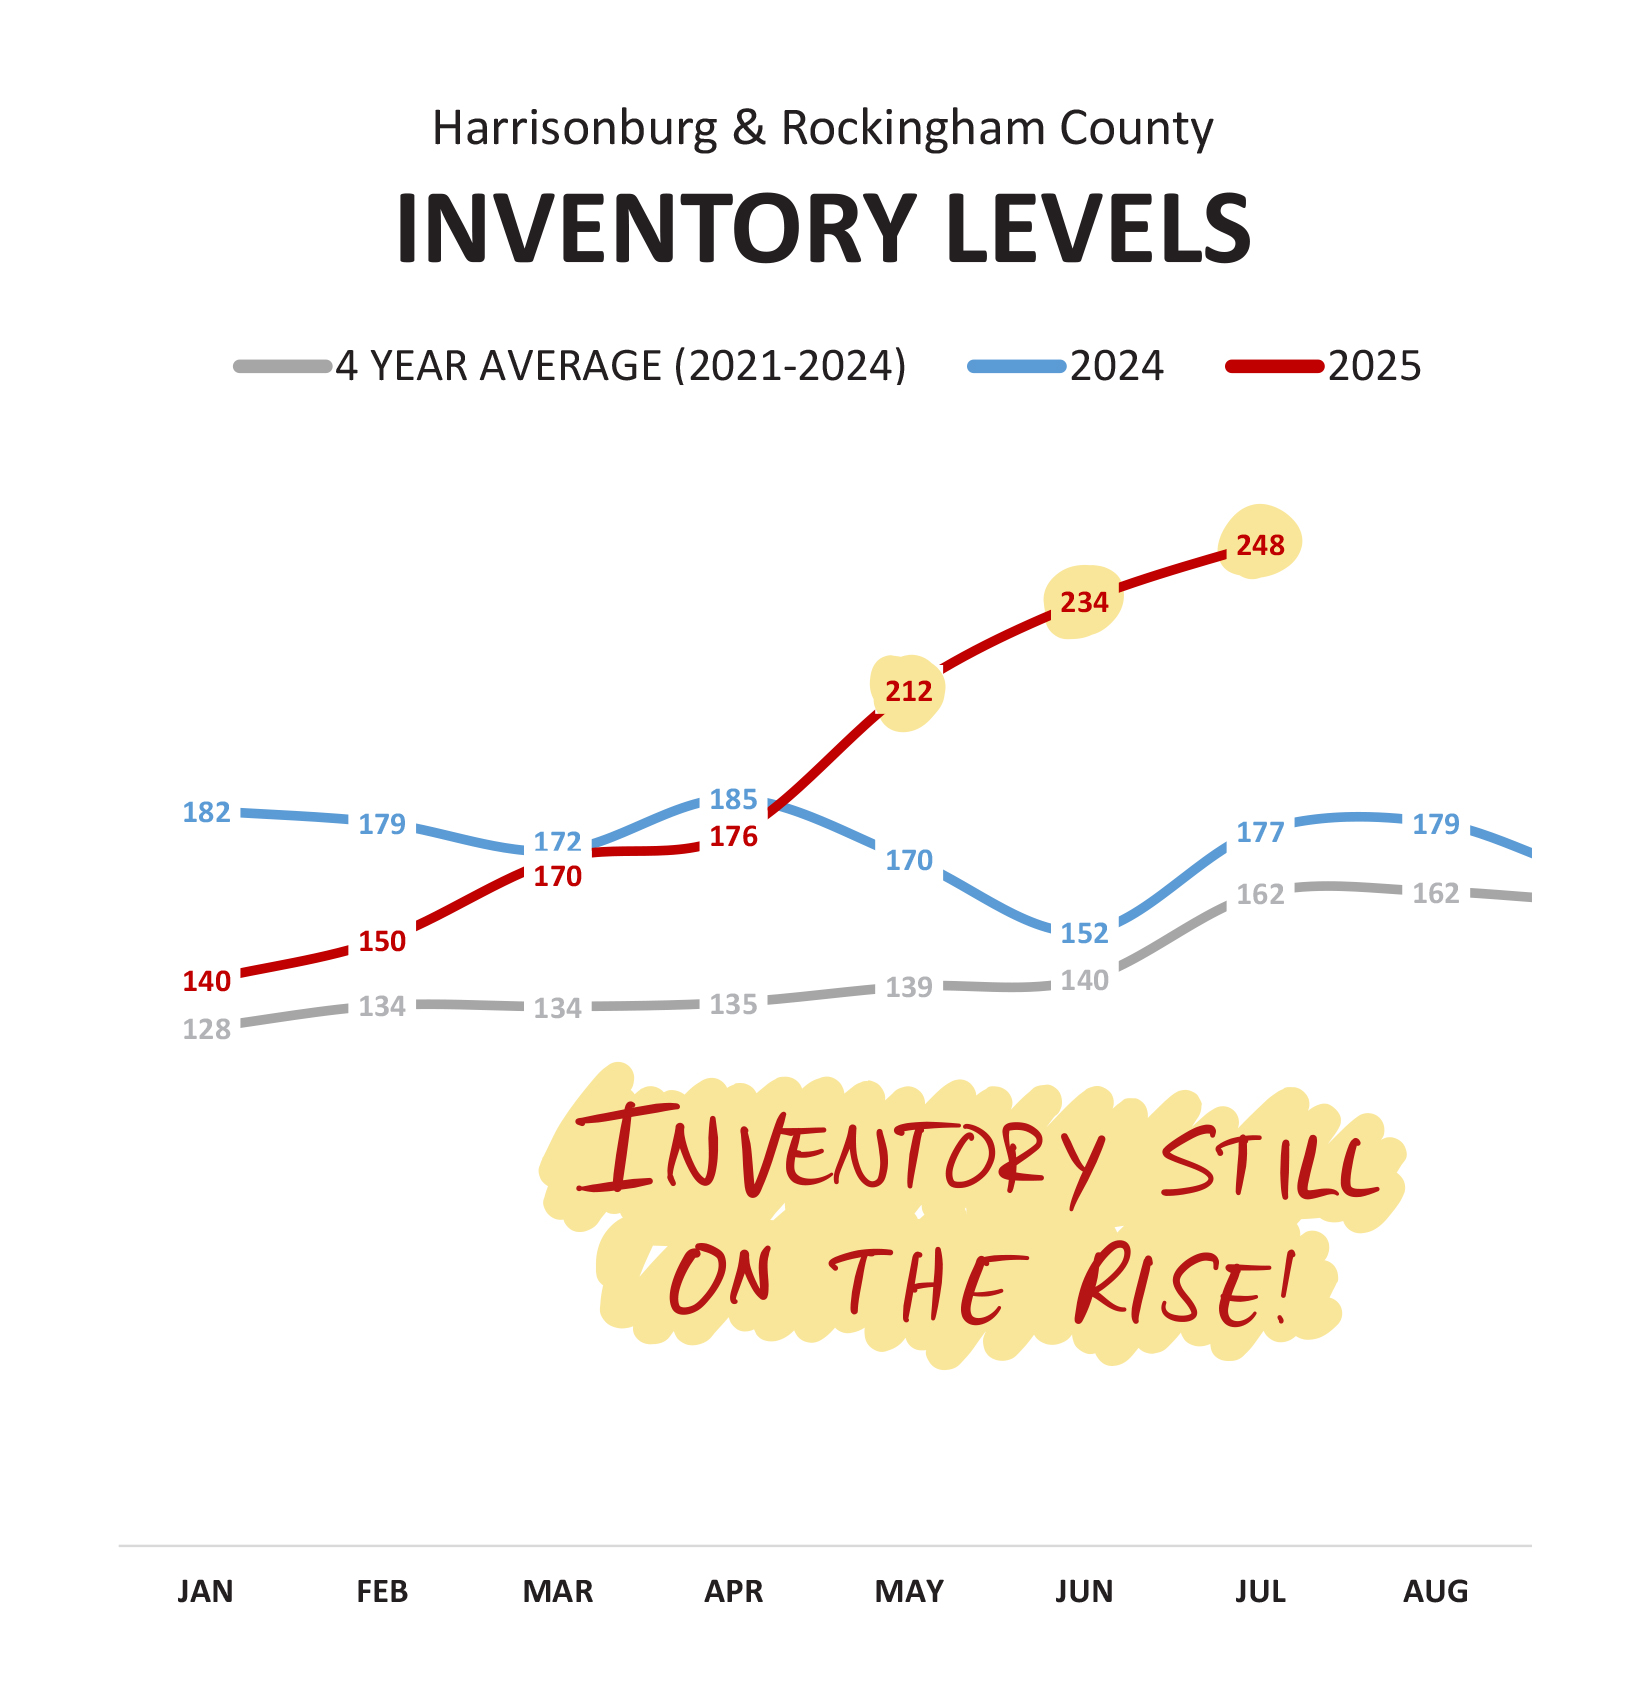
After several years of very low inventory, 2025 has brought a steady increase in the number of homes available for sale each month. There are currently 248 active listings... up 40% from just 177 homes on the market at this time last year.
And finally... here's one graph where we're happy not to see an increase...
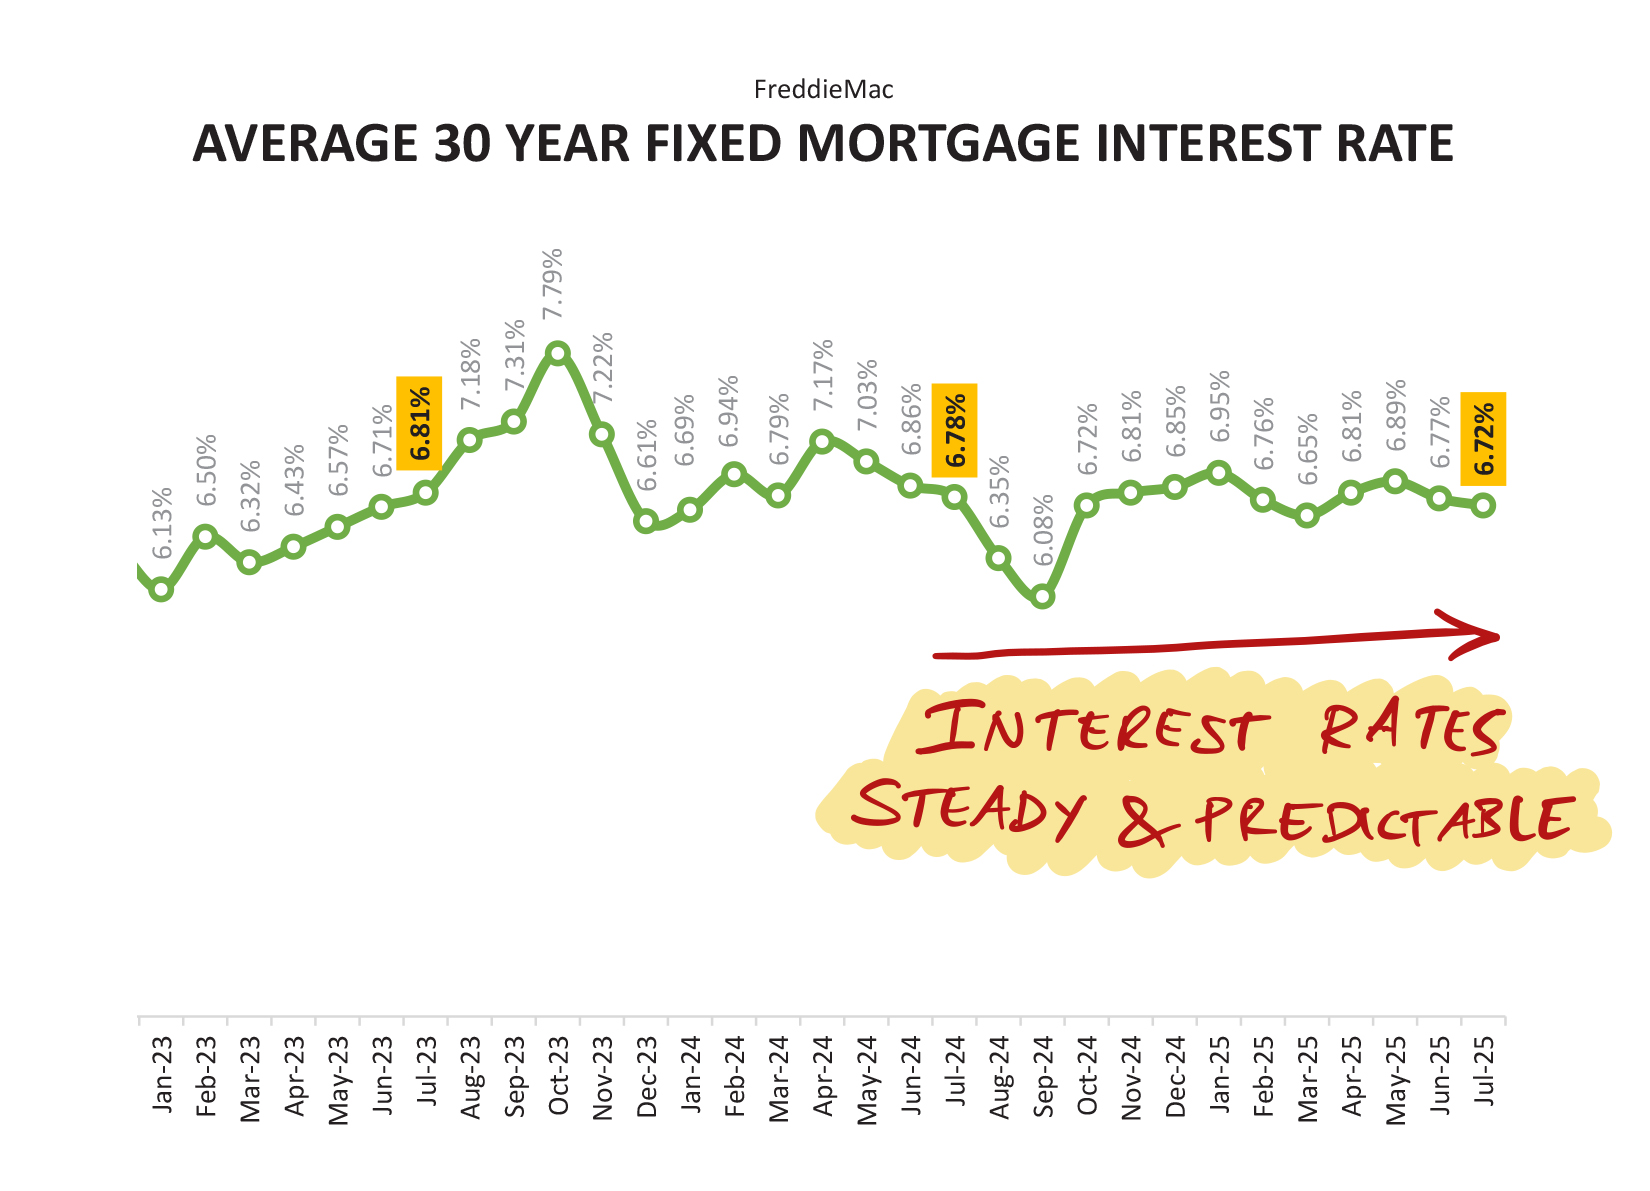
Other than a slight decline in rates last August and September, mortgage interest rates have stayed very steady and predictable for most of the past year. While I'd love to say we will see rates below 6.5% or even closer to 6% later in 2025, I don't think that is a likely reality at this point.
So, after taking in all the data... what does it mean for our local market? And more specifically, what might it mean for you if you're buying or selling a home?
The Overall Market
While we're seeing fewer home sales, and much smaller increases in the median sales price, I think it is still fair to say that we are seeing a steady and stable local housing market.
Sales prices (and home values) don't seem likely to increase as much over the coming year as they have for the past five (+) years... but it seems unlikely that we will see home prices decline.
Furthermore, I can't emphasize enough that these overall market statistics and trends are not predictive of what you will experience in your price range, location, neighborhood, etc.
We are now seeing...
1. Homes going under contract in less than a week with multiple offers.
...and...
2. Homes still on the market for sale after multiple weeks with no offers.
These overall market trends show the overall direction of our local market, but your experience in it will vary based on what you are buying or selling.
If You Are Buying
The good news is that you will likely have more options now than you would have had a year ago, given the 40% year over year increase in inventory levels.
For much of the past five years I would be going to see one house at a time with home buyers... as all other options would have already been under contract. Now, it's not uncommon to be able to go see several houses for sale at the same time, which is refreshing. It's nice to be able to compare and contrast options in real time.
Again, your experience will vary based on your price range as well as where and what you want to buy. Some new listings will be under contract very quickly (so you better go see them today) and some will still be on the market a few weeks or even a month or two from now.
If You Are Selling
With rising inventory levels, we can no longer assume that all homes (or more specifically, that your home) will quickly go under contract in a matter of days. Yes, it's still quite possible that it will, but buyers have more options and are not always acting as quickly.
Preparation, pricing and presentation will be more important than ever. We want your home to show it's best, to be priced reasonably, and to be marketed thoroughly and broadly.
We should plan to price your home based on what buyers have recently paid for similar homes... and be willing to adjust the price if we are not seeing market activity (showings, offers) in a timeframe that fits your goals.
Have Questions?
If you have questions about any of the data above... or about your current home or next home... reach out anytime by phone/text at 540-578-0102 or by email.
If it would be helpful to meet to talk things through... just let me know. I'm happy to meet up to chat over coffee, at my office, or at your house, etc.
Have a wonderful remainder of your week... and if you or your family members have a new school year starting soon, I hope it gets off to a great start!
