Brought to you by , Funkhouser Real Estate Group, , scott@HarrisonburgHousingToday.com
Wednesday, September 18, 2024

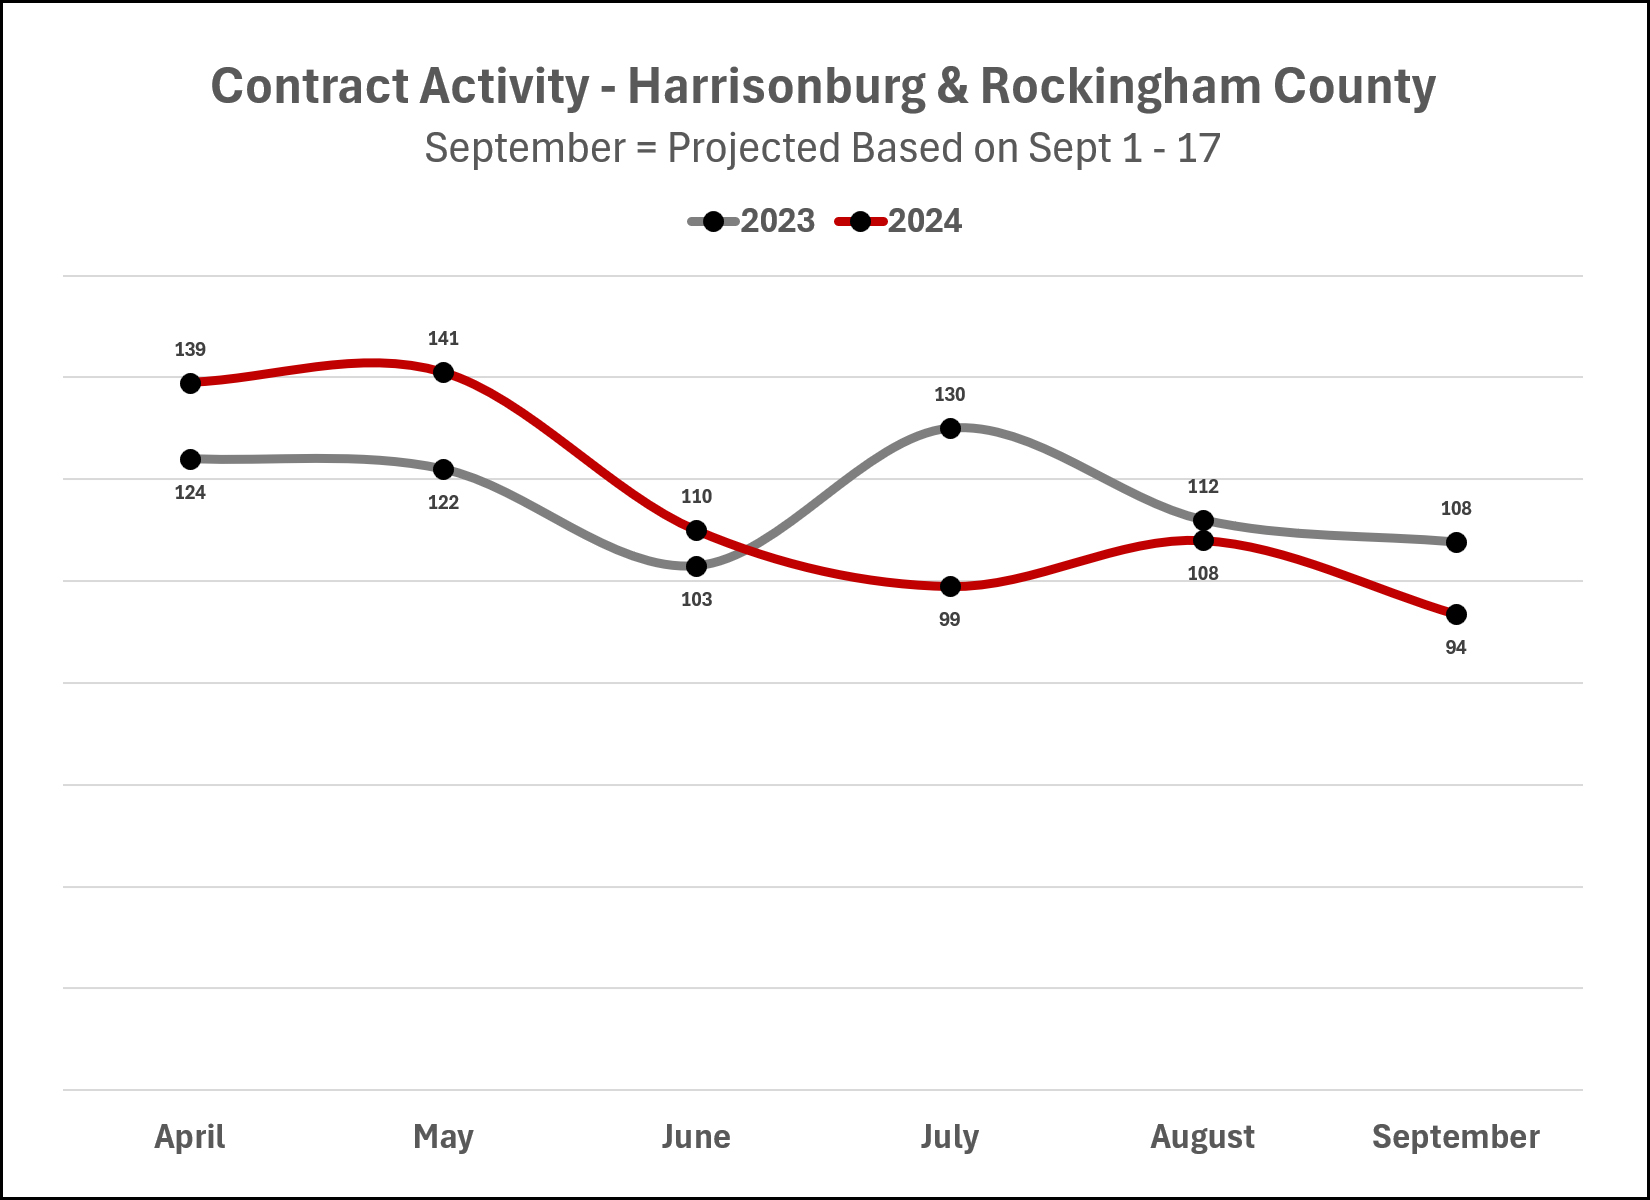
The graph above shows contract activity per month... comparing 2023 (grey line) to 2024 (red line) for each month between April and September.
For the first three months (April through June) we were seeing more contracts signed this year than last.
For the most recent three months (July through September) we have been seeing fewer contracts signed this year than last.
The September data points are projected totals for the month based on contract activity between September 1 and 17 of this year and last year.
Will the second half of September surprise us? Will we see an uptick in contract activity?
What has been keeping contract activity over the past few months?
Will changes in mortgage interest rates over the next few weeks or months impact contract activity?
Stay tuned to see how the Fall housing market starts to shape up in Harrisonburg and Rockingham County.
