Brought to you by , Funkhouser Real Estate Group, , scott@HarrisonburgHousingToday.com
Friday, July 19, 2024

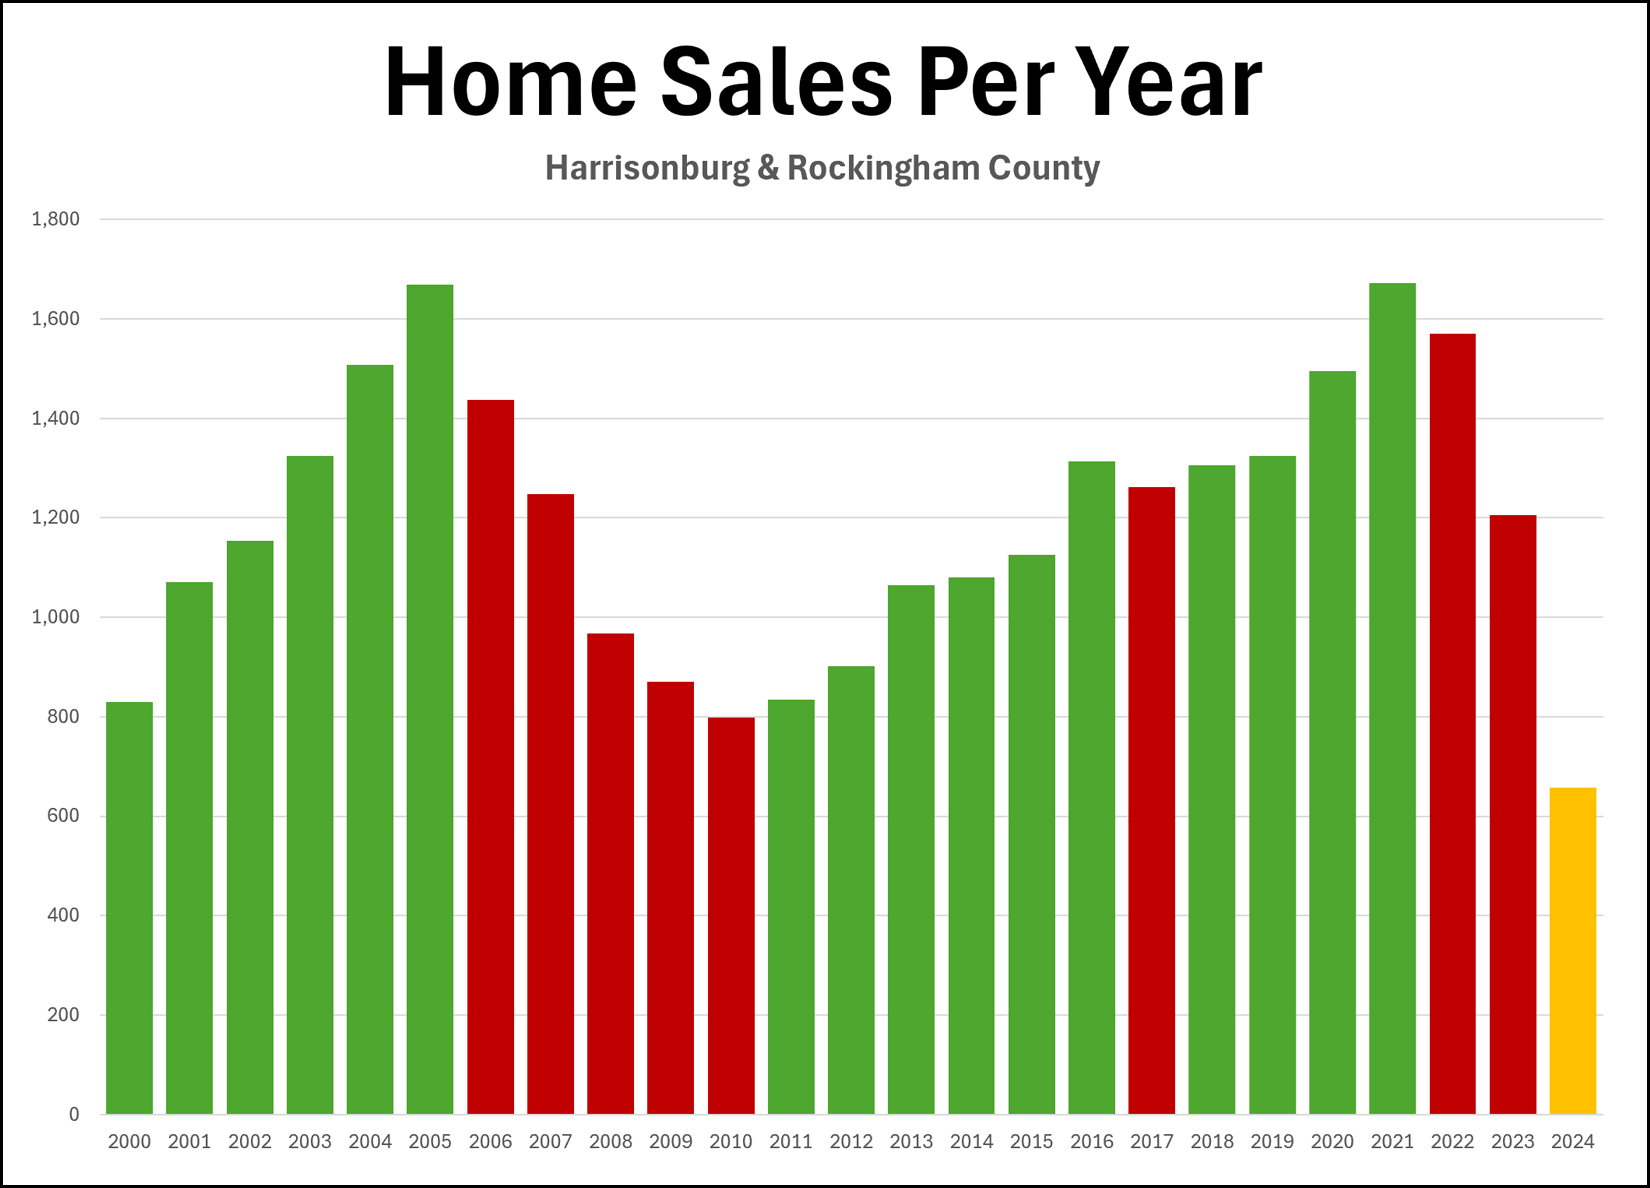
The green bars above show years when the number of home sales (per year) increased compared to the prior year.
The red bars above show years when the number of home sales (per year) declined compared to the prior year.
The past two years (2023, 2022) showed declines compared to the previous year -- but we seem likely to see an increase in 2024.
Home Sales In The First Six Months of 2023 = 610
Home Sales In The First Six Months of 2024 = 658
Perhaps we'll be able to add another green bar to the chart above for 2024, showing an increasing number of annual home sales, yet again.
