Brought to you by , Funkhouser Real Estate Group, , scott@HarrisonburgHousingToday.com
Monday, September 20, 2021

The number of homes that sell in a given timeframe is somewhat indicative of the strength of the local housing market - but not necessarily. The number of homes selling in a given timeframe is affected not only by how many buyers want to buy -- but also how many sellers are willing to sell.
The median price of homes that sell in a given timeframe is a somewhat better indication of the strength of the local housing market - but it is somewhat slow to respond to changes in the market. Even if (when?) the market starts cooling off, we're not likely to see an immediate impact in the sales price of homes.
But days on market -- how quickly homes are going under contract -- that can be an excellent indication of the mood of the local housing market. Independent of how many homes are selling and the prices at which they are selling -- if they are going under contract QUICKLY the market is strong and power is tipped towards sellers -- and if homes are taking a longer time to go under contract the market is not quite as strong and power is starting to balance out between sellers and buyers.
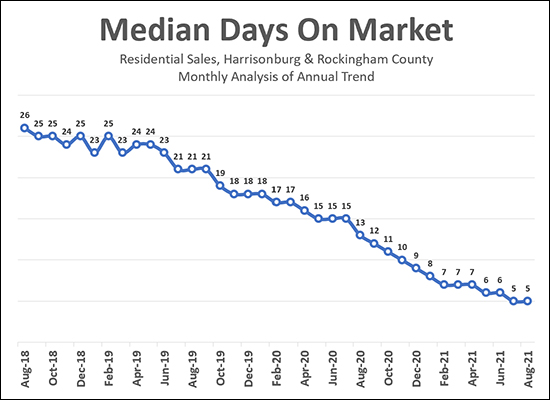
The graph above shows the median days on market (the number of days it takes for a home to go under contract once it hits the market) measured each month by looking at the 12 months leading up to and including that month. So, for example...
- August 2021 = September 2020 through August 2021
- July 2021 = August 2020 through July 2021
Looking at the graph, we can notice a few things...
- The time it takes for homes to go under contract has been steadily declining for several years. I actually pulled data for another two years prior to what is shown and that median days on market kept going higher the further back I looked.
- The median days on market has been a week or less for the past seven months -- which included data from March 2020 through August 2021. So, homes were going under contract ever more rapidly before Covid, but things kept on speeding up as Covid entered the scene.
- Things don't yet seem to be slowing down. At some point, we'll likely see this median days on market figure start to drift upward again, indicating that the market is cooling off a bit -- though I don't think it will be a rapid change.
Some cynics might say -- but Scott, this is looking at a year's worth of data, so it will take months and months to see any changes that are actually happening in the here and now. This is a fair point -- if things are slowing down over the course of a month or two, it might take several more months after that for us to start to see this trend line change. I do, however, intentionally look at this data with a 12 month timeframe. Looking at it with a shorter timeframe makes the data jump up and down a bit more and makes it harder to recognize any trends that are likely to actually be sustained over time.
But, for those who are curious about the most recent of recent data -- when I look at sales from the past two and a half months (7/1/2021-9/20/201) I find that the median days on market is... still five days. :-)
So -- the market is strong, and buyers are moving quickly on new listings, and we're not really seeing that change yet -- but as you'd expect, I'll continue to monitor this trend over time.
