Brought to you by Scott P. Rogers, Funkhouser Real Estate Group, 540-578-0102, scott@HarrisonburgHousingToday.com
Brought to you by Scott P. Rogers, Funkhouser Real Estate Group, 540-578-0102, scott@HarrisonburgHousingToday.com
Monday, August 2, 2021

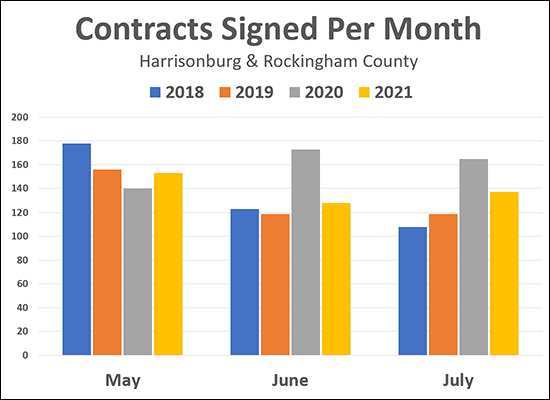
If we just compared this year's contract activity (yellow bars) to last year's contract activity (gray bars) for the past three months we might conclude the following about this year...
- May was a strong month for contracts!
- Contract activity declined sharply in June!
- Contract activity was still quite slow in July!
The conclusion above are likely pretty far off base as a result of what was actually going on (Covid related) last May, June and July -- and thus last year's contract activity is mostly useless in helping us understand this year's contract activity.
MAY: Contract activity was higher this May than last, but that was actually lower than in 2018 and 2019. May was essentially the last month of Covid suppressed contract activity last year. The entire market slowed down in March, April and most of May as everyone tried to figure out whether Covid would affect the real estate market. As such, while this May's contract activity was stronger than last May, it was actually a bit slower than we'd normally expect in May since last May was not normal.
JUNE: Once June (and July) rolled around last year, contract activity started to spike to abnormally higher levels -- likely as a backlog of buyers who would have bought in the spring found themselves scrambling to find something to buy in the summer. Thus, while this June's contract numbers are significantly lower than last June -- they are on par with, and slightly above, the pace of signed contracts in June 2018 and 2019.
JULY: While there were quite a few less contracts signed this July than last -- this July's numbers were quite a bit higher than July of 2018 and 2019. Again, this seems to be a weird month of July last year that makes this July look off (slow) when in fact it is the opposite.
In the end, we all know that the local housing market has been booming for the past year (plus) and more particularly this year and even more particularly, this spring and summer. Thus, if a quick glance at a data set at first leads you to a conclusion (contract activity is falling) that seems contrary to a general understanding of current market dynamics, it is often helpful to zoom out a bit and try to see a clearer picture on a larger data set.
