Brought to you by , Funkhouser Real Estate Group, , scott@HarrisonburgHousingToday.com
Thursday, April 15, 2021
Happy not-really-tax-day, friends! (taxes are due May 17 this year)
What a wild first three months of the year it has been thus far in the Harrisonburg and Rockingham County real estate market!
Before starting to pick through the data to find some meaningful insights, here are a few general notes for you...
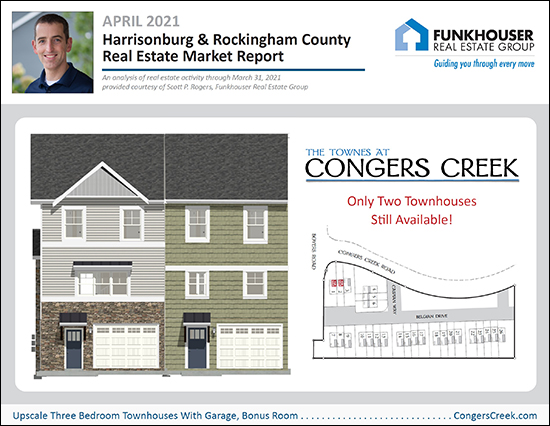
- The properties featured above are under construction at Congers Creek, a new townhouse community on Boyers Road just a short walk / jog / ride / drive from the hospital. Of the 26 townhouses to be built, all but two are now under contract!
- You can download the full PDF of charts and graphs from this month's market report here.
- This is the time of year where you may be giving some thought about whether you will sell your home this spring or summer. Email (scott@hhtdy.com) or call / text me (540-578-0102) if you'd like to set up a time to meet or chat.
Now, let's dive right into the data and see what we can learn about our local housing market...
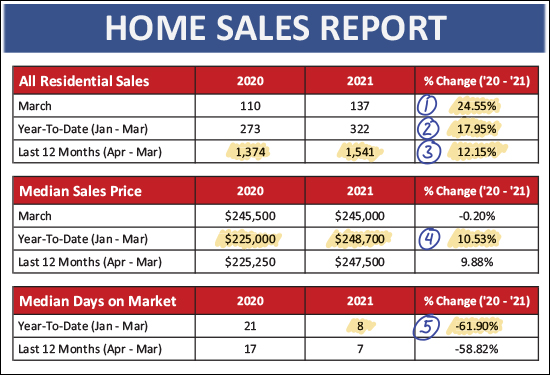
OK, some of these numbers (above) are just bonkers...
- There were 137 home sales in March 2021 which was 25% higher than last March!
- Home sales in the first quarter of 2021 were 18% higher than in 2020! (I am going to run out of exclamation marks soon!)
- Over the past year there have been 1,541 home sales, a 12% increase from the prior year when there were only 1,374 sales.
- The median sales price in the first quarter of 2021 was $248,700 -- which was a 11% increase over the first quarter of 2020 when the median sales price was only $225,000. That is an increase over $20K in a year.
- The median days on market (time from listing to contract) dropped 62% in the first quarter of 2021 compared to the first quarter of 2020 -- down to a median of only eight days on the market!
Now, then, let's take a look at a break down of detached homes (single family homes) and attached homes (duplexes, townhomes, condos)...
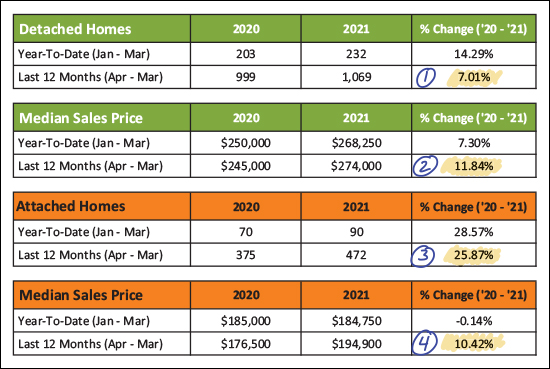
A few things to note when we look at this data sliced a bit differently than in the first data table...
[ 1 & 3 ] While sales of detached homes increased 7% over the past year compared to the prior year, sales of attached homes increased 26% during that same timeframe.
[ 2 & 4 ] The median sales price of detached homes increased 12% over the past year which is just slightly higher than the 10% increase in the median sales price of attached homes.
Chopping the data up one more time by City vs. County we can note some differences as to how these two portions of our local market are performing...
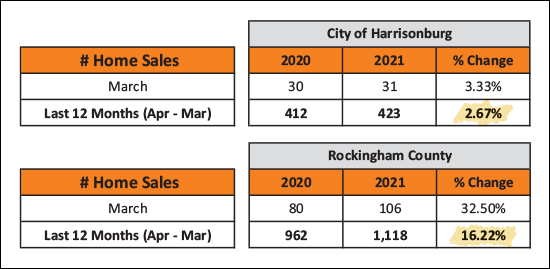
The data above is just looking at where we are seeing home sales increase and by how much. Over the past year there has been a 3% increase in the number of homes selling in the City -- while there has been a 16% increase in the number of homes selling in the County. I believe this is primarily because the majority of new construction is now happening in the County -- thus those sales numbers have more of an ability to grow as compared to the City numbers where most home sales are resales.
OK, next, let's visually contextualize that exciting month of March...
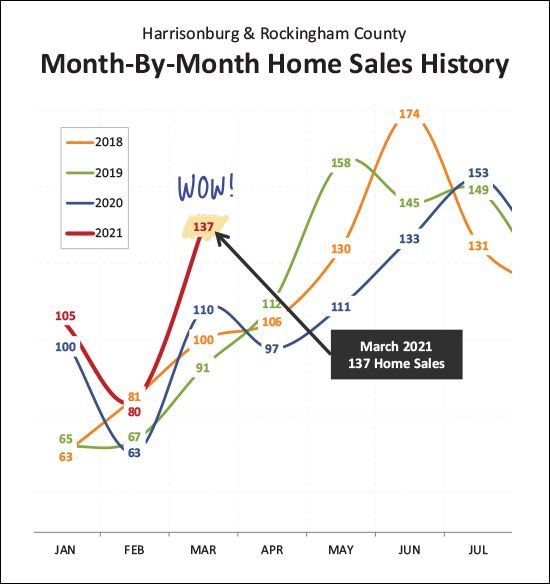
Indeed, March was a BUSY month of home sales in Harrisonburg and Rockingham County. While I am only showing three years of data above, the file I'm working in when I create these reports includes data all the way back to 2003 when I started in real estate. There has never, in that time, been a month of March where we have had 137 or more home sales in Harrisonburg and Rockingham County!
Given contract data (we'll look at that a bit later) it seems likely that we will see another strong month of sales in April and May, which means the year is likely shaping up to be a year of a LOT of home sales. Which leads me to...
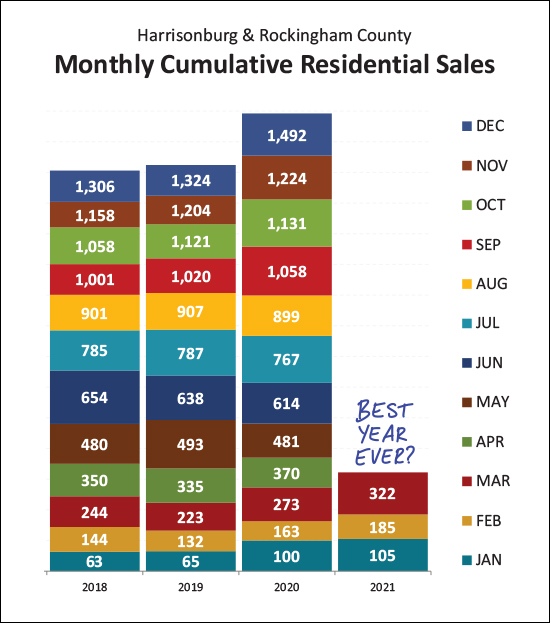
I put this graph together by stacking each month of home sales on top of the prior to see how each new year stacks up in comparison to past years. As you can see, above, this year (2021) is currently poised to be the best year ever as far as the number of properties selling in Harrisonburg and Rockingham County.
So, lots of homes selling, how did we get here?
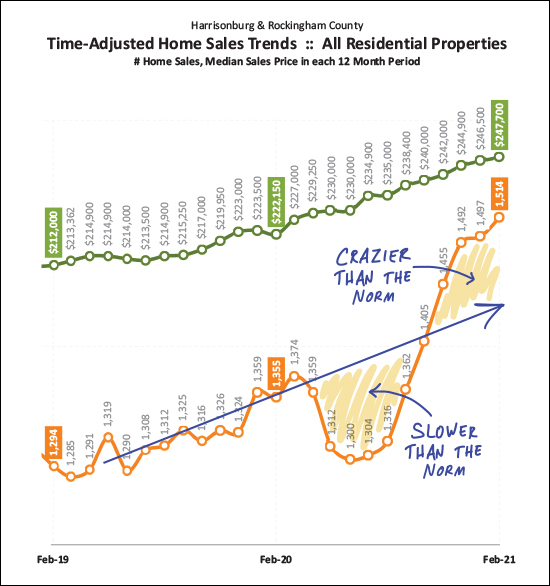
We didn't get here (1500+ home sales) without some turbulence. A year ago we had seen a slow and steady increase from 1300 sales/year up to 1350 sales/year. Then the COVID dip and then the COVID spike! Looking back, we had a five month period with far fewer home sales than we would have expected given our overall trajectory. And now, we are in the fourth month of what a much (much!) more active market than we would have expected given our overall trajectory.
Now, you might find yourself saying that things have been crazy for MUCH longer than four months. Yes, you are right. The graph above is looking at a rolling 12 months of home sales, which evens out some of the peaks and valleys of home sale seasonality, but also can mean it takes longer for overall trends to appear.
And yes, I know you probably didn't need a graph to tell you that a lot of homes are selling these days... but this graph made me realize that these two conflicting realities are being experienced daily in our local market...
- There are more homes selling per year now than we've seen anytime over the past 10+ years.
- There are fewer homes on the market now than we've ever seen anytime over the past 10+ years.
But I digress. Lots of homes have been selling. What is to come over the next few months?
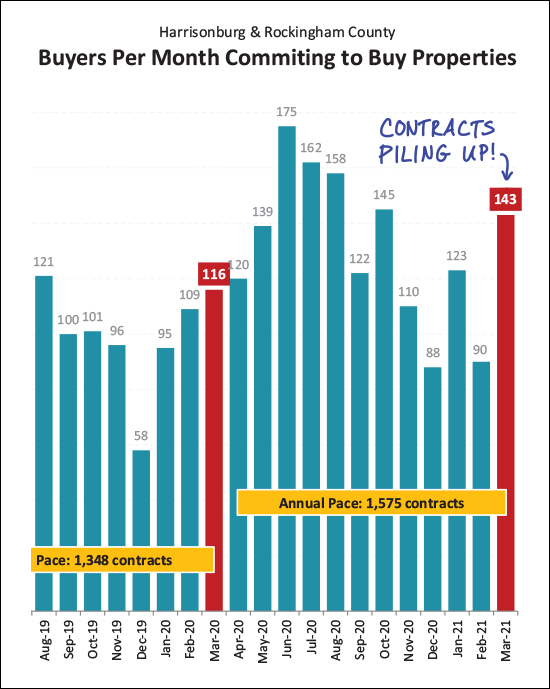
Well, based on a STRONG month of contract activity in March (143 contracts) it would seem that we'll continue to have strong months of home sales in the coming month or two. Furthermore, we're entering into what is typically one of the busiest seasons for buyers to be buying homes, so I expect contracts and closed sales to continue to stay at higher levels for the next five or six months, at least!
And now, I think I mentioned (or you may have heard) that there aren't many homes for sale right now...
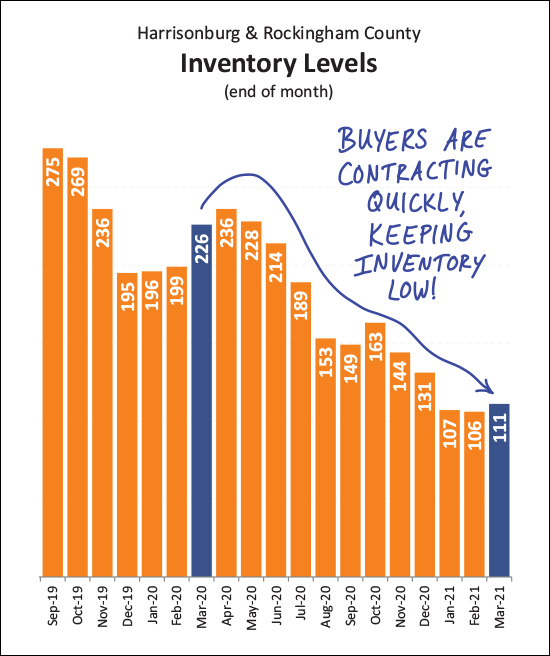
Yes, it is true. Even though we are seeing an ever increasing number of homes selling, we are also seeing an ever declining number of available listings. As I recently commented to a client, if we start the month with low inventory and 5,000 homes are listed for sale and 5,000 homes go under contract, we will still end the month with low inventory.
As such, understand low inventory fully by remembering that...
- Low inventory does mean that buyers have very few options at any given time.
- Low inventory does not mean that not many homes are selling.
Finally, just one more graph for your perusal...
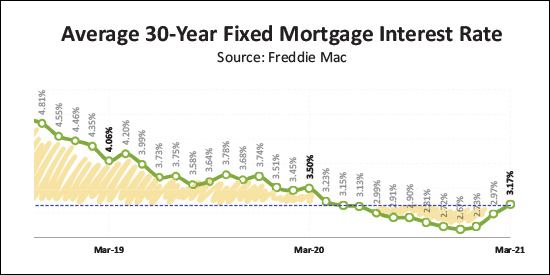
This graph shows trends in the average 30 year fixed rate mortgage interest rate and there are a few things to note here as well...
- Interest rates are on the rise. We have seen rates rise from 2.67% in December to 3.17% at the end of March.
- Interest rates are still lower now than they have been for the majority of the past several years (shown) and an even longer time period that is not shown.
- Some wonder (or suspect) that if interest rates keep rising that might eventually cause the housing market to cool off a bit -- perhaps from a roaring inferno to a blazing inferno? :-)
Alright, that's all I have for you at this point. You are now up to speed on the latest news and developments in our local housing market.
But if you are thinking about buying or selling sometime soon, these general market trends are only part of what you want (and need to know) as you also should dig into the market in which you are hoping to buy or sell -- whether that is best defined by price range, location, property type, etc.
If I can be of help to you as you make plans to list your home for sale, or to seek a home to purchase, just let me know. I'd be happy to meet with you in person, via Zoom, or to chat by phone to help you think and talk through the possibilities. You can reach me at scott@hhtdy.com or via phone/text at 540-578-0102.
Until we chat, or until I write again, here a few final tips...
Sellers - Even though the market is hot, you still need to prepare your home well, price it appropriately based on historical sales data and market it thoroughly and professionally.
Buyers - Get prequalified for a mortgage, start stalking new listings, go see them on the first day they hit the market, and get ready to compete in a multiple offer situation.
Seller / Buyers - If you need to (or want to) sell in order to buy, this will require a bit more strategery than normal. It can be done, but we need a solid plan in place from the start.
