Brought to you by , Funkhouser Real Estate Group, , scott@HarrisonburgHousingToday.com
Wednesday, July 15, 2020
Happy Tax Day! Yes, that's right, today is the extended deadline for filing and paying income taxes. But the day is still young, so read on for an update on our local housing market before you go submit your tax filing. ;-)
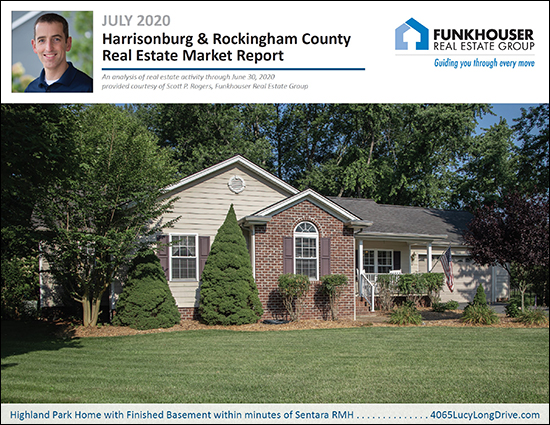
But first -- check out this recent listing (shown above) in Highland Park priced at $365K by visiting 4065LucyLongDrive.com.
Two other notes before we get started...
- You can download a full PDF of my market report here.
- I'm suffering from my second severe case of poison ivy this summer and I'm a bit punchy on prednisone. There are plenty of tidbits of good news in this month's market report and hopefully the steroids won't make me any more giddy than I should be. ;-) You've been warned - I'm writing this market report under the influence...
OK, now, on to the data...
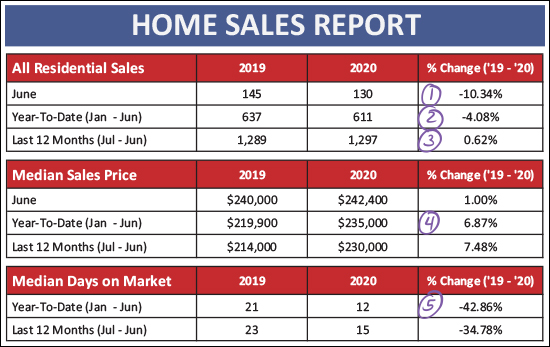
We're now officially halfway through the year when looking at year-to-date sales figures and there is plenty of interesting trends to note above...
- The 130 closed sales in June 2020 marked a 10% decline from last June. This is not altogether surprising given the slower months of contract activity over the past few months.
- There have been 4% fewer closed sales in the first half of 2020 as compared to the first half of 2019. A few months ago when COVID-19 was just starting to impact us locally, I thought the drop off in home sales activity could have been much more significant than it actually has turned out to be.
- When looking at a full year of home sales, the annual pace of closed sales is up a bit less than 1%. There have been 1,297 home sales in the past year as compared to 1,289 during the prior 12 months.
- The median sales price has increased almost 7% in Harrisonburg and Rockingham County in the first six months of 2020 as compared to the first six months of 2019 and is now hovering at $235,000.
- Homes are selling faster (!!!) than last year given the 43% decline in the median days on market in the first half of 2020 as compared to the first half of 2019. The median days on market is now only 12 days! Half of homes that sold in the first half of 2020 were under contract within 12 days of being listed for sale!
Now, let's take a brief look at detached homes compared to attached homes. Attached homes includes duplexes, townhomes and condos.
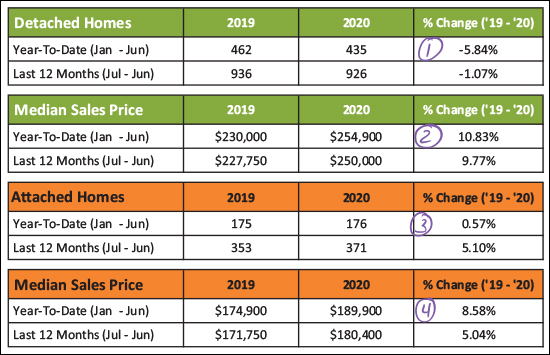
As shown above...
- There have been almost 6% fewer sales of detached homes in the first half of 2020. We saw 462 such sales between January and June of 2019 and only 435 such sales in the same timeframe in 2020.
- Those 435 detached homes sold for almost 11% more than the homes that sold in the first half of 2019. The median sales price rose of detached homes increased from $230,000 to $254,900!
- There was only a tiny uptick in attached home sales during the first half of this year. We saw 175 such sales between January and June of 2019 and an increase to 176 sales this year.
- The median sales price of these attached homes rose nearly 9% in the past year from $174,900 in the first half of 2019 up to $189,900 in the first half of 2020.
So, prices have risen quite a bit between 2019 and 2020 even without much of an increase (actually a slight decrease) in the number of homes that are selling.
But perhaps the trend in the pace of home sales is shifting...
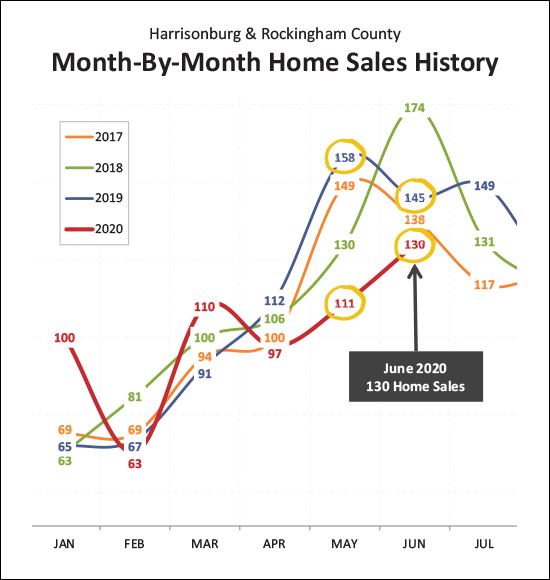
If you look at the four numbers I circled in gold above, you'll see that May 2020 home sales were drastically lower than May 2019 -- but the gap between June 2020 and June 2019 was not as severe. Perhaps we are starting to see home sales pick back up again? At least some of the (slight) decline in home sales in 2020 seemed to be a result of fewer would-be home sellers listing their homes for sale which gave would-be
home buyers fewer options for buying.
Now, looking at some longer term trends...
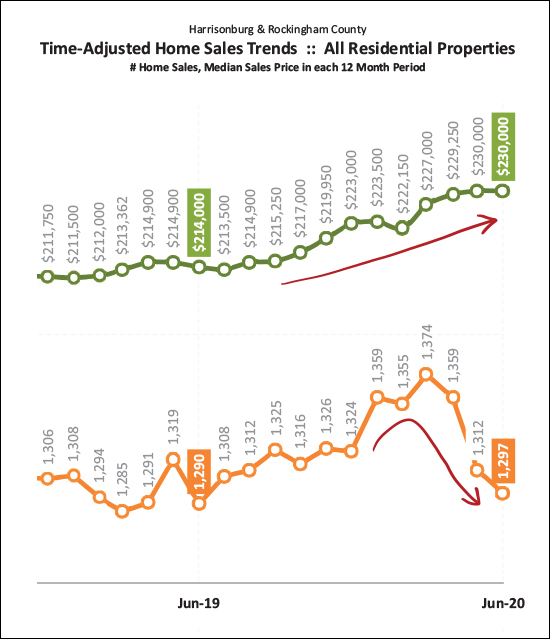
The data above looks at a moving 12-month set of data, and we're seeing divergent trends now. The median sales price (green line) keeps on steadily rising -- while the annual pace of home sales (orange line) has been drifting downward over the past three months. As noted above, fewer sales seems likely to be a result of fewer sellers being willing to sell and not fewer buyers being willing to buy -- which would at least partially explain why prices keep on rising.
All of this means that is definitely still a STRONG seller's market...
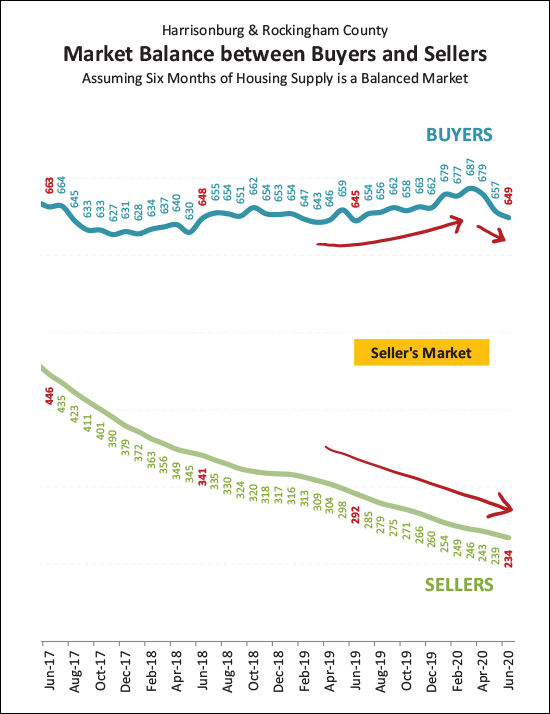
As shown above, the number of buyers buying in the market has stayed rather steady over the past few years (though it has dropped off a bit over the past few months) while the number of sellers selling (inventory at any given time) continues to decline. This makes it an absolutely wonderful time to be a seller -- and probably a not very fun time at all to be a buyer. And, well, if you need to do both (sell and buy) you'll be both ecstatic and depressed!
This next stat might surprise you...
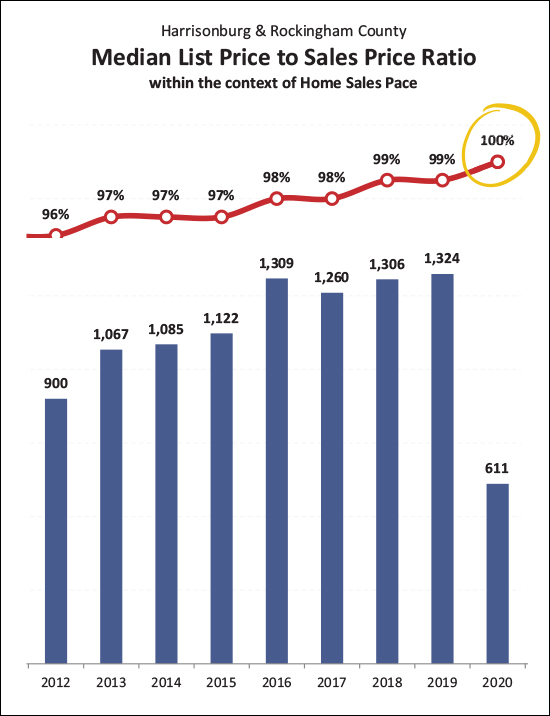
I did not see this one coming! I'll dive a bit deeper into this in the coming days, but it seems that the median "list price to sales price ratio" has risen to 100% in 2020! That means that half of sellers are selling below their list price and half of sellers are selling ABOVE their list price!? I knew sellers were having to negotiate less and less on price -- but this statistic is still rather shocking. Again, I'll dive deeper into the data in coming days to see what else I can uncover here.
And set your coffee cup back down, because here's another surprise for you...
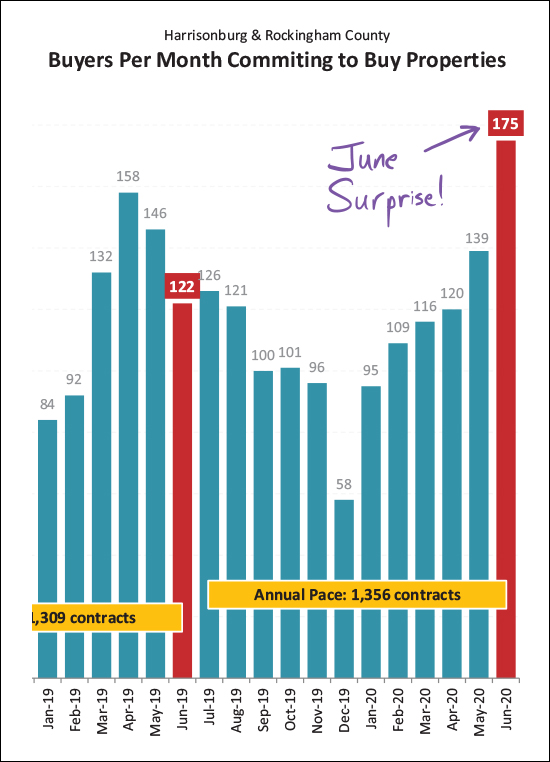
Contract activity in the first five months of the year was lagging behind this year (-5%) as compared to last year. But when we factor in June contracts, not such much! Now there have been 3% more contracts in 2020 than in the same timeframe in 2019, mostly because of the astonishingly high 175 contracts signed in June 2020! Wow! Again, I'll break this down further over the next few days to try to better understand this spike in contract activity.
And as is likely NO surprise, inventory levels keep on dropping...
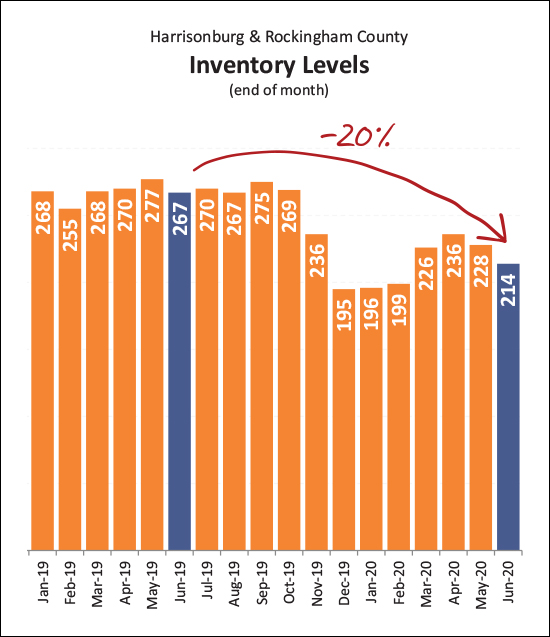
There are currently only 214 homes for sale in Harrisonburg and Rockingham County -- which is 20% lower than where we were a year ago. I was hopeful that we'd see inventory levels pick up a bit during the spring -- which didn't really happen. Maybe we'll see some late summer, early fall increases??
Finally, on to this super low, historically low, ridiculously low interest rates...
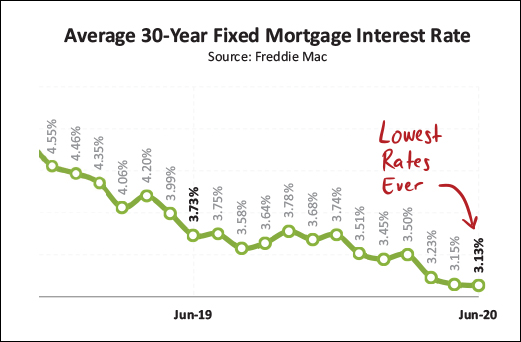
Buyers financing their home purchases over the past few months have enjoyed some absurdly low mortgage interest rates. The current average is 3.13%, which is the lowest EVER and I've even had some buyer clients pay a point or so to get under 3% -- on a 30 year fixed rate mortgage! Wow!
OK - that about wraps up my monthly run down of what is happening in our local real estate market. Stay tuned over the next few days for some deeper analysis of some of the trends as mentioned above. If you have questions about what I have discussed, or about other market trends you are observing, shoot me an email.
Otherwise, until next time...
- SELLERS: Yes, it's a seller's market - but we still need to stay focused on the same old, same old - price, condition and marketing.
- BUYERS: Get pre-approved, stalk the new listings, and be ready to go see houses of interest quickly and to make an offer quickly, keeping in mind how to make your offer as strong as possible.
Finally... if you're thinking about buying soon, or selling soon, and are looking for a Realtor to assist you with that process - I'd be happy to connect with you at your convenience. You can reach me most easily at scott@HarrisonburgHousingToday.com or by calling/texting me at 540-578-0102.
Have a great second half of the first month of the second half of the year! :-)
