Brought to you by Scott P. Rogers, Funkhouser Real Estate Group, 540-578-0102, scott@HarrisonburgHousingToday.com
Brought to you by Scott P. Rogers, Funkhouser Real Estate Group, 540-578-0102, scott@HarrisonburgHousingToday.com
Thursday, April 9, 2020

While out for a run earlier this week, listening to a podcast about the news and current events related to COVID-19, one of the people on the podcast made a comment that resonated with me.
He said that whenever someone asks him how he thinks COVID-19 is going to affect ____ (fill in the blank with whatever you'd like) he starts by asking them how long they think COVID-19 will still be impacting our daily lives.
The same likely holds true as it relates to the local housing market. How will COVID-19 affect home prices (or the pace of home sales) in Harrisonburg and Rockingham County? Well, it likely depends on how long you think COVID-19 will continue to impact our daily lives.
Consider these three scenarios from a timeline perspective...
- Things magically get better in the next few weeks and most folks are back to work by May 1, and we're not all spending 95% of our time at home.
- We're mostly staying at home and working from home until June 10, as per the governor's current executive order.
- This stretches on much longer and we're all staying at home and working from home through August 31.
These three different timelines would likely result in very different impacts on our local housing market.
But since none of us really know how the future timeline is going to play out, we can't accurately predict if or how the local housing market will be impacted by COVID-19.
What we can do, however, is look backwards to see what impact we can observe as time passes.
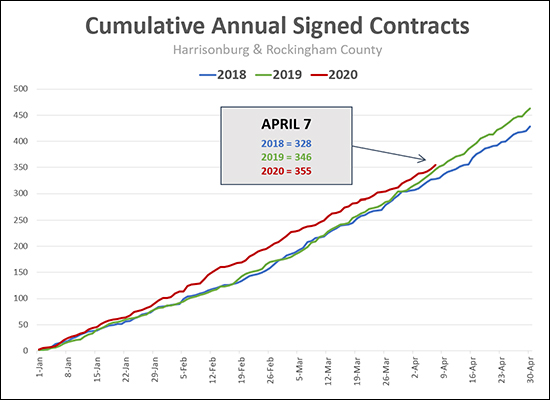
All that to say -- the graph multiple paragraphs above where you're reading now shows the cumulative number of buyers who signed contracts during the first four months of this year as compared to 2018 and 2019.
As you'll note, this year started off much stronger than 2018 and 2019 - but over the past few weeks, cumulative buyer activity has been slowing back down slightly, now approaching the 2019 trajectory. Don't read that as all bad news, though, as thus far in 2020 we have still seen more buyers sign contracts than during the same timeframe in 2019, despite COVID-19.
And two possibly necessary notes to make sure you understand this data:
- The graph is based on data of when buyers sign contracts, not when they close on their purchase. So this is as real time of data as we can get.
- If a buyer contracts to buy a house and then that deal falls apart such that the property is actively for sale again, that (now non-existent) contract is not counted in the data above.
As we continue through this unprecedented time, I'll continue to monitor where we are and contemplate where we might be headed, and I'll share it with you here.
If you have questions about how all of this relates to your plans for potentially buying or selling a home, feel free to reach out by sending me an email - scott@hhtdy.com.
