Brought to you by Scott P. Rogers, Funkhouser Real Estate Group, 540-578-0102, scott@HarrisonburgHousingToday.com
Brought to you by Scott P. Rogers, Funkhouser Real Estate Group, 540-578-0102, scott@HarrisonburgHousingToday.com
Tuesday, July 23, 2019

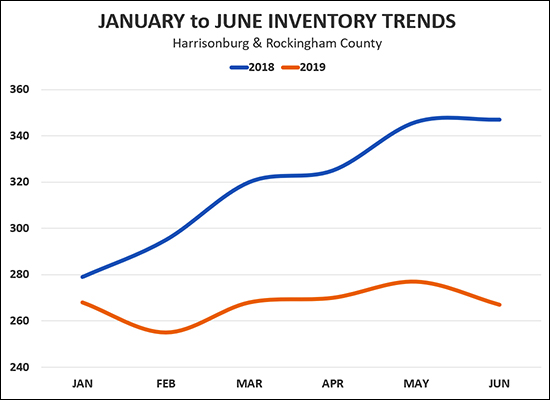
The blue line above shows the number of homes for sale at the end of the month for the first six months of last year, 2018.
The orange line shows the same (homes for sale at the end of the month) for the first six months of 2019.
Last year, inventory levels rose 24% between the end of January and the end of June.
This year, inventory levels actually dropped negligibly (by one listing) between the end of January and the end of June.
So - for all you would-be home buyers out there feeling like you don't have many options, or that the ones you do are going under contract quickly after having had multiple offers, the data backs up the pain you are feeling.
What's next? How do we get out of this trend of fewer and fewer homes for sale? New construction is the likely anecdote, but there doesn't seem to be a whole lot on the horizon right now.
