Brought to you by , Funkhouser Real Estate Group, , scott@HarrisonburgHousingToday.com
Tuesday, June 11, 2019
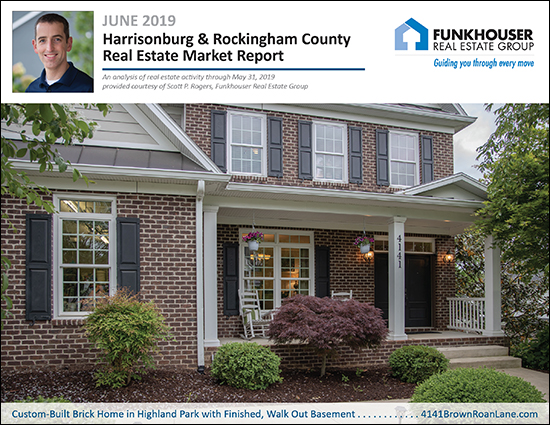
We're nearly halfway through the year and 2019 is shaping up to be a strong year of home sales, very similar to last year. But before we dive into the data, here are a few quick links...
- Find out more about this month's featured home at 4141BrownRoanLane.com.
- Download a PDF of this month's full market report here.
Now, let's see what the data is showing us this month...
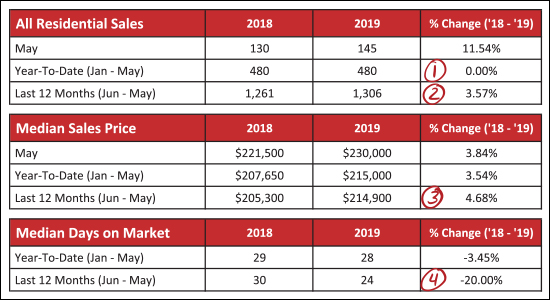
As shown above, we have seen a solid start to the year, now five months in...
- Thus far in 2019 there have been 480 home sales in Harrisonburg and Rockingham County -- exactly the same number as we saw last year in the first five months of the year.
- The annual pace of home sales has climbed 3.57% over the past year up to 1,306 sales per year.
- The median sales price has risen 4.68% over the past year -- from $205,300 up to $214,900.
- The time it takes a home to go under contract, once listed, has fallen 20% over the past year -- from a median of 30 days to a median of 24 days.
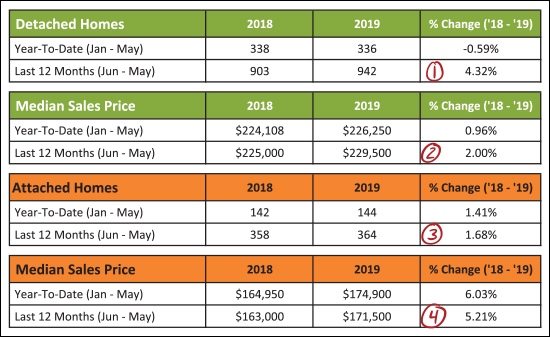
Breaking things down a bit further, as outlined above, we'll start with the green portions of the chart -- which are detached homes...
- We've seen 4.32% more detached home sales over the past year as compared to the prior year.
- The median sales price of those detached homes has increased 2% over the past year -- from $225,000 to $229,500.
The orange section above represents attached homes -- including duplexes, townhouses and condominiums, where we find that...
- The annual pace of attached home sales has risen just 1.68% over the past year -- from 358 sales to 364 sales.
- The median sales price of these attached homes has increased 5.21% over the past year -- from $163,000 to $171,500.
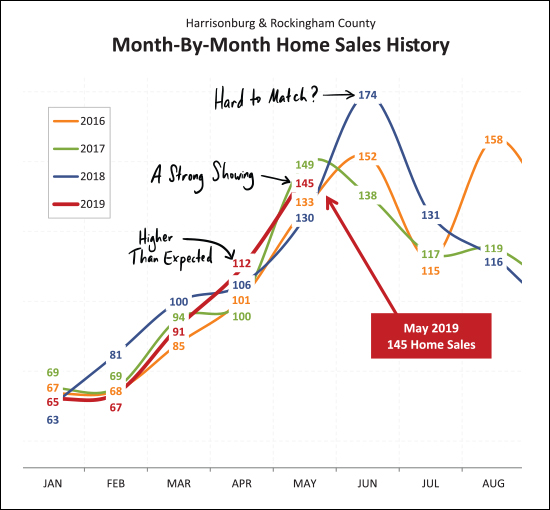
As you look at the graph above, find the dark red line and follow it from month to month from January through May to see how this year compares to previous years. What you'll find is that January, February and March were nothing special -- at all. They were slower or the slowest such months from the past few years. But once we hit April, things started to change -- we saw more home sales in April than any of the past three months of April -- and May home sales were also stronger than two of the past three months of May.
So, as noted above -- April was surprisingly high, May was a pretty strong showing, but June, that might be where this year starts to slow down, comparatively. Last June we saw a surprising, historic, 174 home sales in a single month. It seems rather unlikely that we'd see that many home sales this June.
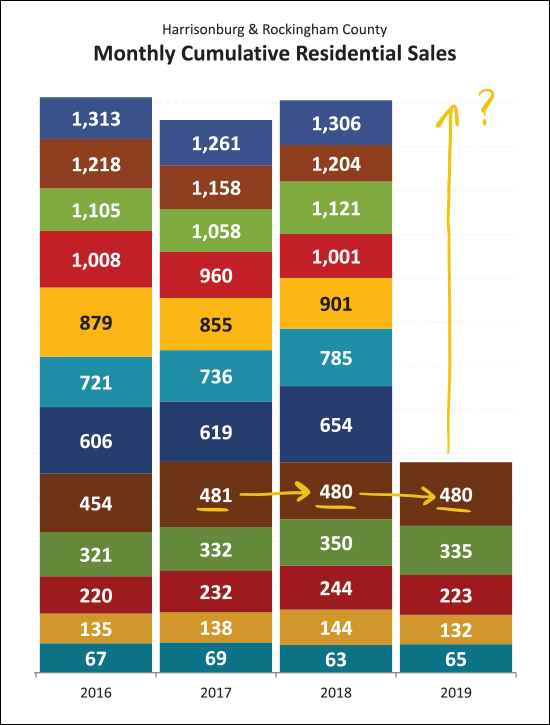
This tall, colorful, graph shows each month of home sales stacked on top of the prior month -- and you'll see that the first five months of this year have tracked pretty consistently with the first five months of each of the past two years. So, it seems reasonable to think we might end up somewhere around 1280 - 1300 home sales for the full year of 2019. Stay tuned as the year continues to develop.
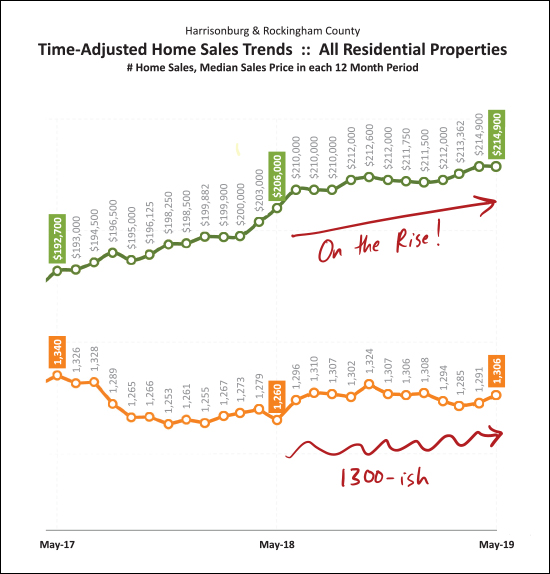
This graph shows looooong term trends -- tracking a rolling twelve months of data when it comes to the quantity of home sales and the median price of those home sales.
The highly technical 1300-ish red squiggle at the bottom of the graph represents the meandering annual pace of home sales as shown in orange. We've been somewhere around an annual pace of 1300 home sales for the past 12 months or so -- with the most recent (two month trend) heading us in a positive direction.
The top, green, line is showing the long term trend for the median sales price of homes in Harrisonburg and Rockingham County. The median sales price keeps on climbing -- from $193K to $206K to $215K over the past two years.
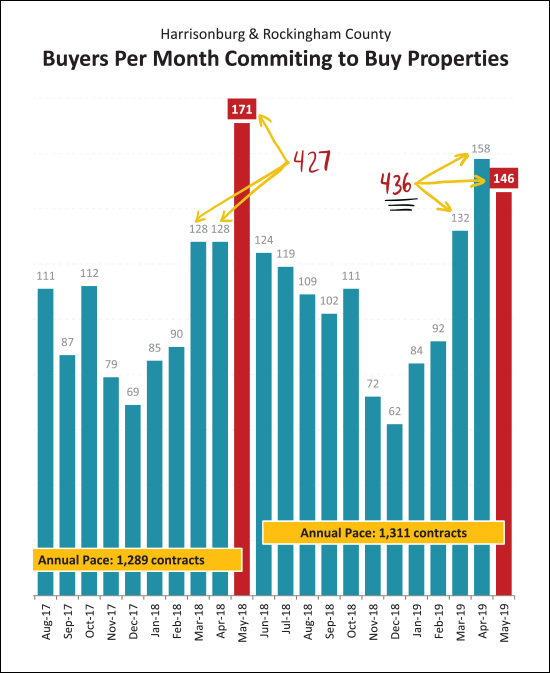
Sometimes looking at a single month of data can throw us off -- getting us overly excited or overly depressed. Last May (2018) we could have been elated about the incredibly strong month of contracts -- though it followed two slower months in March and April. This year we saw strong months of contracts in both April and May -- even though neither reached the 171 contracts seen last May. But in the end, March-May contracts only added up to 427 contracts last year -- and 436 this year -- so, a net increase.
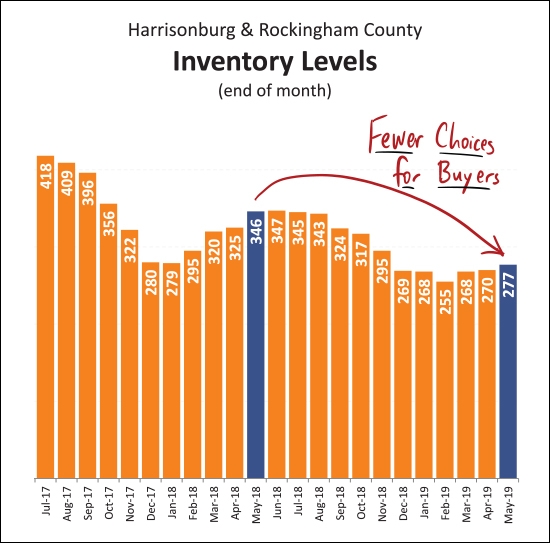
And so, as shown above, the sad story continues -- it is a tough time to be a buyer. Inventory levels might be rising and falling seasonally (rising, slightly, right now) but the overall trend over the past several years has been fewer and fewer homes for sale at any given time. This causes buyers to have fewer choices at any given moment -- and requires that they be able to act quickly and decisively when a house of interest comes on the market.
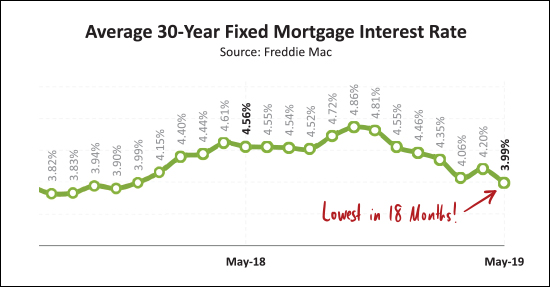
I'm not always convinced that month to month increases or decreases in mortgage interest rates can specifically spur on buyer activity (there has to be a house listed for sale that you actually want to buy) but the lower (and lower, and lower) mortgage interest rates of late certainly don't hurt!
We haven't seen mortgage interest rates below 4% in over a year -- and right now many mortgage lenders are quoting rates of 3.875%, 3.95%, etc. An exciting time to lock in a fixed mortgage interest rate!
Alright -- we'll wrap it up there for now, though keep in mind that there is a LOT more in my full market report, which you can download as a PDF here.
And -- if you're getting ready to buy or sell -- here are some things to keep in mind...
SELLERS -- even though it is a seller's market in just about every price ranges right now, you must still focus on price, condition and marketing.
For further reading on buying or selling in this area, check out....
