Brought to you by Scott P. Rogers, Funkhouser Real Estate Group, 540-578-0102, scott@HarrisonburgHousingToday.com
Brought to you by Scott P. Rogers, Funkhouser Real Estate Group, 540-578-0102, scott@HarrisonburgHousingToday.com
Monday, April 15, 2019
Just like that - the year is already more than 25% behind us. Looking back over home sales activity during the first quarter we find a mixed bag of market indicators.
Before we delve in, two quick links...
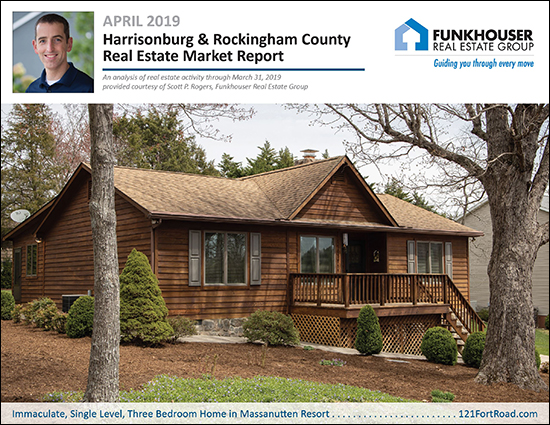
- Check out the featured home pictured above by visiting 121FortRoad.com.
- Click here to download a PDF of my entire market report.
Now, on to the data...
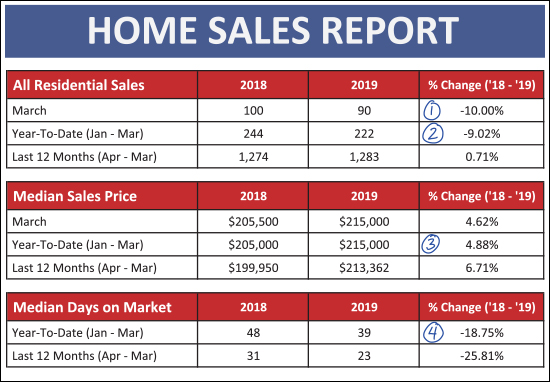
As shown above...
- Home sales in March 2019 were 10% slower than last March.
- This brought the year-to-date sales pace to 222 home sales for the first quarter of 2019, which is 9% slower than the 244 home sales seen in the first quarter of 2018.
- The median sales price of all properties sold in the first quarter of 2019 was $215,000 - marking a 5% increase from a year go - but read on for why prices may not have actually increased 5%.
- Homes are selling 19% more quickly in the first quarter of 2019 (median of 39 days on market) as compared to the first quarter of 2018 when the median was 48 days on market.
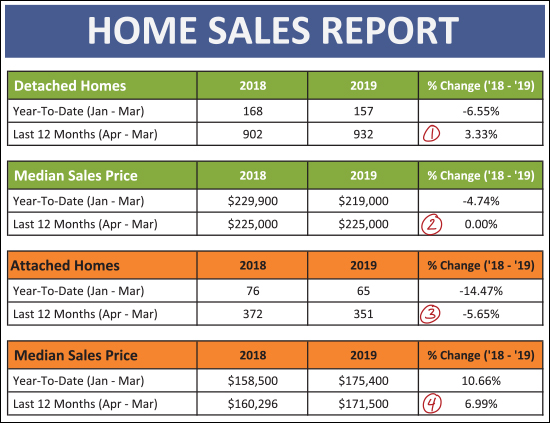
The green rows above are showing sales activity for detached ("single family") properties. The orange rows are for attached properties - which includes duplexes, townhouses and condos.
- Over the past year, 932 detached homes have sold, marking a 3.33% increase over the 902 sold in the year just before that.
- The median sales price of detached homes sold in the past year was $225K - exactly the same as in the year just before that. There's the price plateau for you.
- There has been a 6% decline in the annual pace of attached home sales - which dropped from 372 sales to 351 sales.
- The median price of attached home sales keeps on rising - with a 7% annual increase from $160,296 to $171,500.
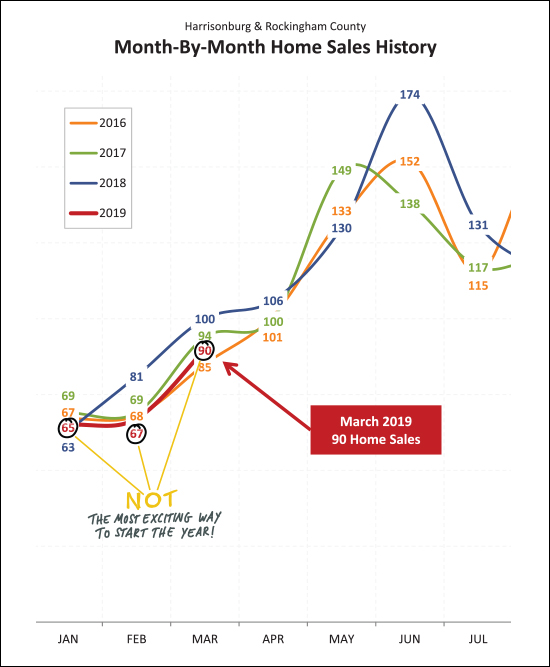
Here (above) is a visual of the not-so-exciting way that this year has begun when we look at monthly home sales compared to the same months in recent years. February home sales were the slowest out of the past four years - and January and March were the second slowest. So - clearly - a slow start to the year - but keep on reading for some news on contract activity.
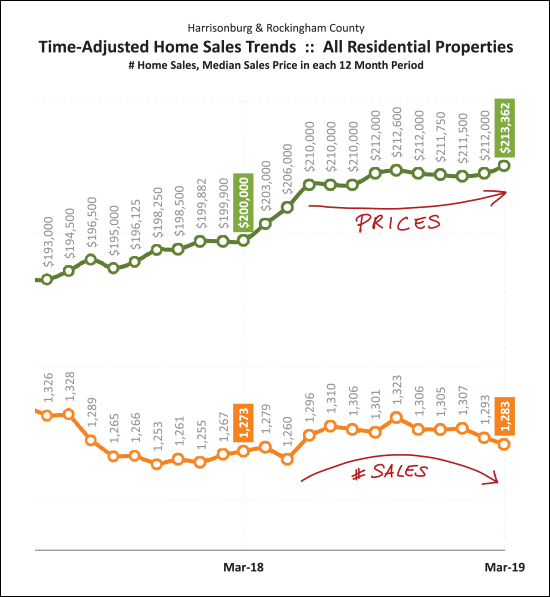
The graph above explores long term (rolling 12 month periods) trends in home sales and prices. Over the past year we have seen sales start to trend slightly downward - while prices have trended slightly upwards. Nothing drastic in either direction, really, but those are the general directions we're seeing the market move. Of note - the rising prices shown above have more to do with a change in the mix of what properties are selling (more higher priced detached homes and fewer lower priced attached homes) more than an actual increase in values. As shown a bit ago (scroll up) the median sales price of detached homes has remained flat over the past year.
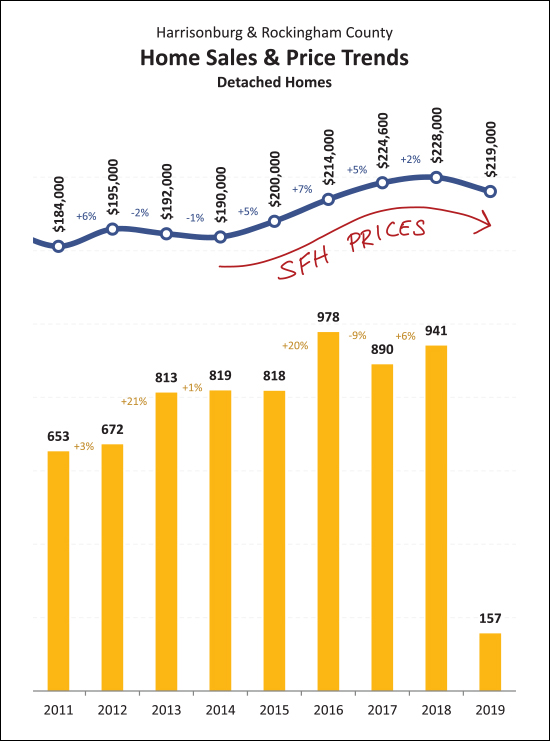
Here's a slightly more depressing view of value trends for detached homes. Over the past few years the increase in sales prices has been decreasing (+7%, +5%, +2%) and with data only from the first quarter of 2019, the median sales price has actually declined. I am guessing that we'll actually end up with a net gain in median sales price once all 2019 data is in the books, but for now, prices are appearing slightly soft when just viewing first quarter data.
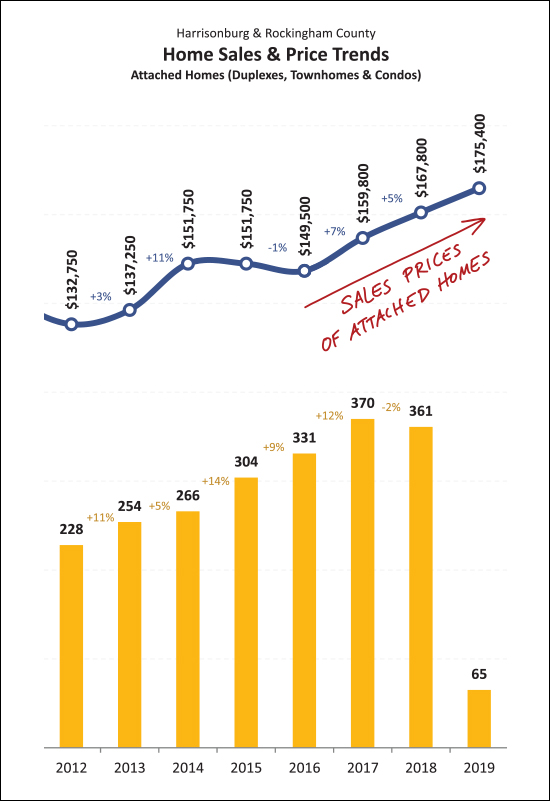
But if you're selling an attached (duplex, townhouse, condo) property - the state of the market is looking promising! As shown above, the prices they just keep on rising. Part of this is likely a result of constrained supply (not enough new townhouses being built) amidst increasing demand. This is keeping sales prices on the rise and that doesn't show signs of stopping in the near term.
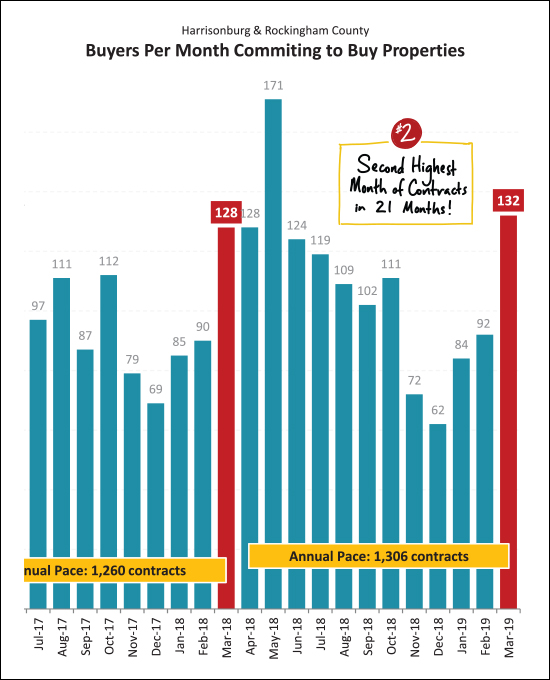
OK - hopefully you read this far - because here is the silver lining of the first quarter of our local housing market. Despite slower sales in the first quarter, contract activity was STRONG in March 2019. In fact -- it was the second strongest month of contract activity in the past 21 months! This should lead to strong months of closed sales in April and May, and hopefully this is just the beginning of a strong Spring and Summer of contracts being signed.
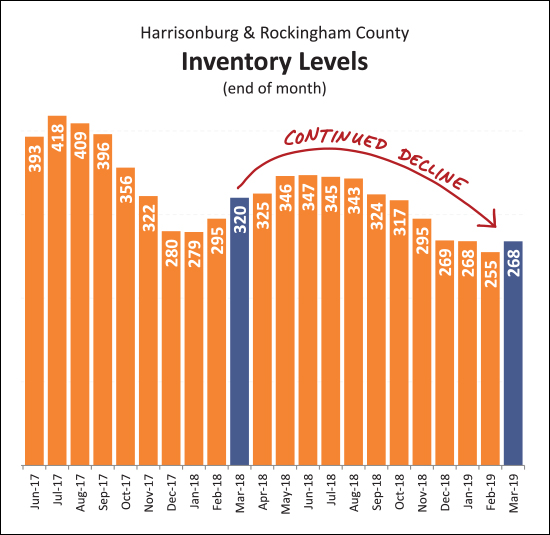
For the past few years I kept saying I didn't think inventory levels could drop any further. Well, they did, they have, and somehow the market keeps on moving. As shown above, despite a monthly increase in inventory levels between the end of February and end of March, we have seen another year-over-year decline in the number of homes on the market. Unless we see a significant growth in new construction in this area, these low inventory levels are likely to remain the norm for the next few years.
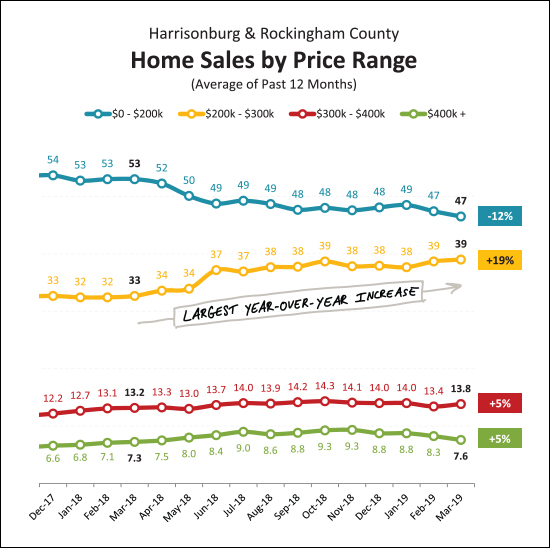
And here's a bit of trivia for you -- the fastest growing price segment of our local housing market is --> the $200K - $300K price range. There has been a 19% increase in sales of homes between $200K and $300K, which is the largest increase of any of the price categories shown above.
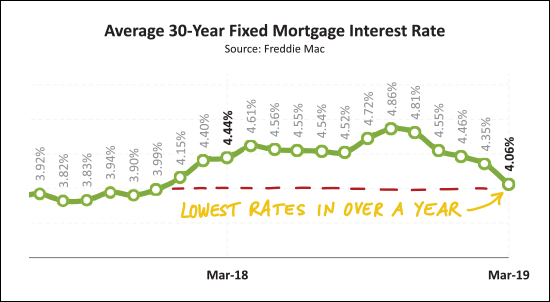
What brought on the strong surge of contract activity in March 2019? Could it be the sudden drop in mortgage interest rates, down to an average of 4.06%? Probably not just that -- it was likely also a surge in new listings combined with anxious buyers who had seen very few options over the winter months. But the low mortgage interest rates likely helped and were an added bonus to anyone making a decision to commit to a home purchase during March 2019.
Well, folks, that's a wrap. You read to the end of my overview of our local housing market. You can delve into even more details by downloading a PDF of the full report here. And as always, if you have questions about our local housing market feel free to be in touch.
My guidance to local soon-to-be home buyers and sellers remains consistent...
SELLERS -- even though it is a seller's market in just about every price ranges right now, you must still focus on price, condition and marketing.
For further reading on buying or selling in this area, check out....
