Brought to you by Scott P. Rogers, Funkhouser Real Estate Group, 540-578-0102, scott@HarrisonburgHousingToday.com
Brought to you by Scott P. Rogers, Funkhouser Real Estate Group, 540-578-0102, scott@HarrisonburgHousingToday.com
Monday, January 7, 2019

OK - these numbers are a bit abstract, but still interesting, in my opinion.
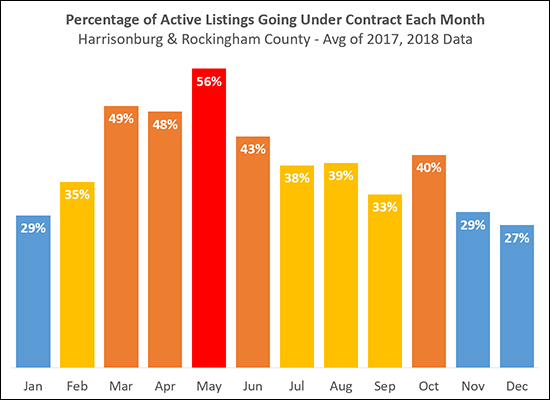
The graph above is NOT showing a distribution of when buyers are buying homes.
The likelihood of selling your home in a given month, per the graph above, is calculated by dividing the number of houses listed for sale at the start of each month by the number of houses that then go under contract that month. So -- if 300 houses are listed for sale at the start of the month, and 150 houses go under contract that month, you had a 50% chance of your house selling.
This is somewhat inaccurate (we'll call it abstract, instead) because other houses do come on the market during that month. But still - by calculating the likelihood of selling in the same way each month we get a relatively reasonable comparative analysis of the likelihood of selling in any given month of the year.
As should come as no surprise, you are most likely to sell your home in March, April, May or June -- or October!
The months when you are least likely to sell your home are November, December and January -- and good news -- two of those months are already behind us!
