Brought to you by , Funkhouser Real Estate Group, , scott@HarrisonburgHousingToday.com
Monday, September 10, 2018
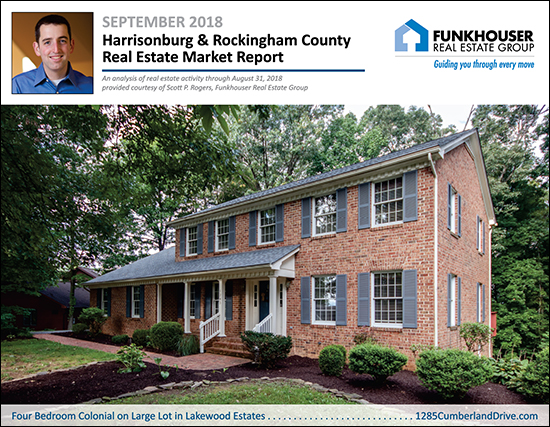
First, learn more about this new listing in Lakewood Estates by visiting 1285CumberlandDrive.com.
Now, on to our local real estate market -- I just published my most recent monthly market report, and as usual, you can read on for an overview, download the full report as a PDF or tune in to my monthly video overview of our local housing market...
Now, let's take a look at some the trends we're currently seeing in our local housing market...
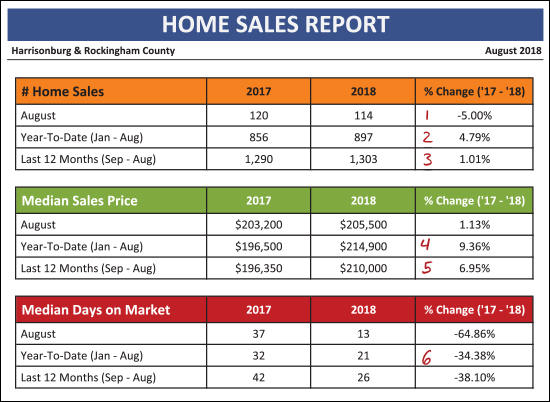
As shown above...
- Home sales slowed 5% in August 2018 as compared to August 2017.
- The year-to-date pace of home sales (Jan-Aug) has increased 4.79% as compared to last year.
- Looking at a full 12 months of sales, the pace of home sales has increased 1% over the past year.
- The year-to-date median sales price has increased 9.36% over the past year to $214,900.
- Looking at a full 12 months of sales, the median sales price has increased 6.95% over the past year to $210,000.
- Homes are selling 34% faster this year (21 days) as compared to last year.
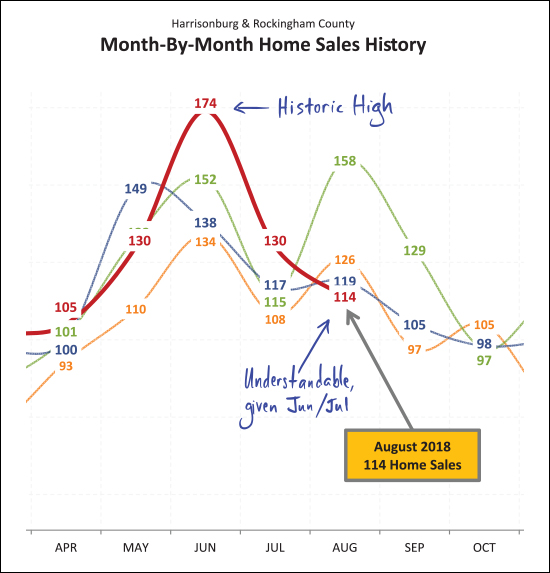
After an extraordinarily robust month of sales in June (174 -- third highest month ever) home sales slowed a bit in July, but remained (at 130) higher than in any recent July. It should be no surprise then that home sales cooled (even if temperatures did not) in August. Perhaps many summer buyers bought earlier in the summer this year than last.
In the chart above, orange = 2015, green = 2016, blue = 2017 and red = 2018. So...
Jun + Jul + Aug in 2016 = 425 summer buyers
Jun + Jul + Aug in 2017 = 374 summer buyers
Jun + Jul + Aug in 2018 = 418 summer buyers
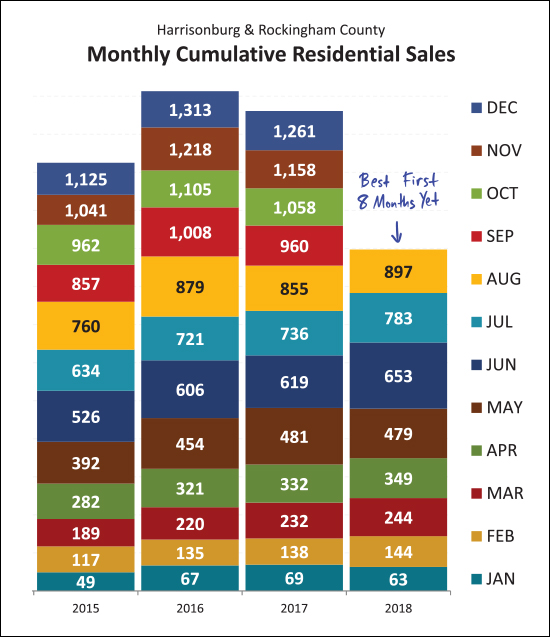
We have seen 897 home sales in the first eight months of the year -- this is more home sales than we've seen in any recent first eight months of the year. At this point, we seem poised to see another 1300+ year of home sales -- which we have only seen one other time in the past decade.
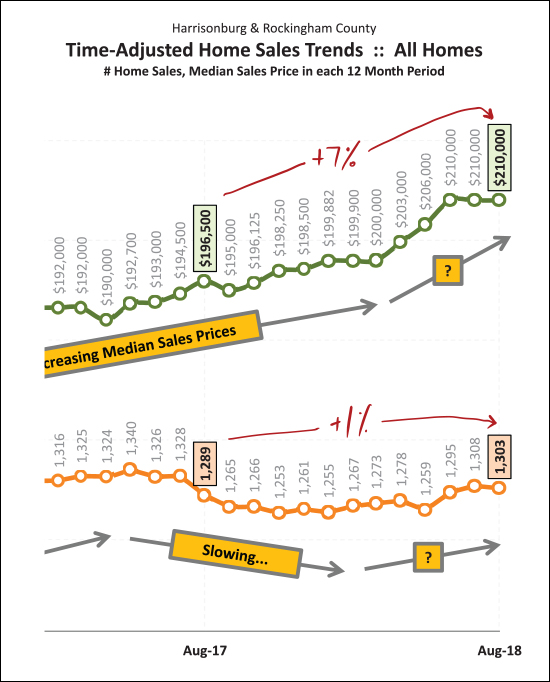
Looking at a rolling 12 month data window -- we see that there has been a net 1% increase in the pace of home sales per year (up to 1303/year) and a 7% increase in the median sales price (up to $210K) over the past year. The median sales price escalated quickly from $200K to $210K this Spring but now has stayed put at $210K for the past few months.
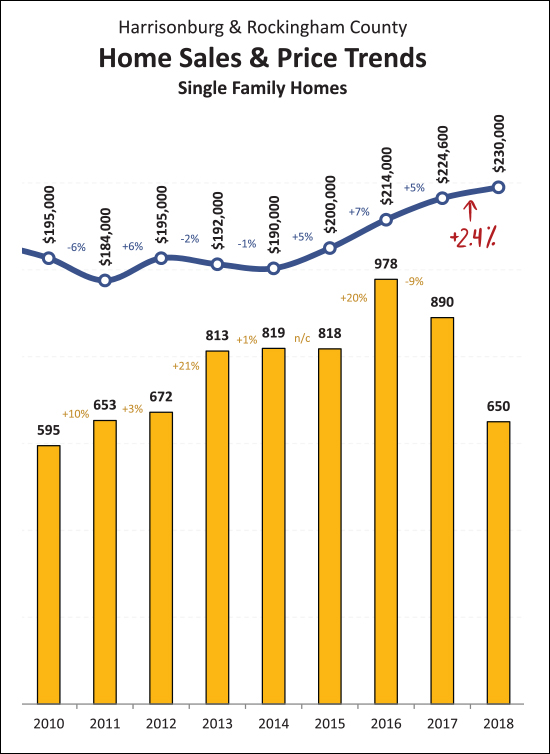
I have never been happier to see such a modest increase in prices as I am to see the 2.4% increase in the median sales price of single family home as shown above. The 7% increase in median sales prices shown on the prior graph reflects not just increases in home values but perhaps a shift in which homes are selling. By looking at only single family homes (excluding duplexes, townhouses and condos) we can (sometimes) get a better sense of actual changes in home values. Here we see that single family home sales prices have increased only 2.4% over the past year.
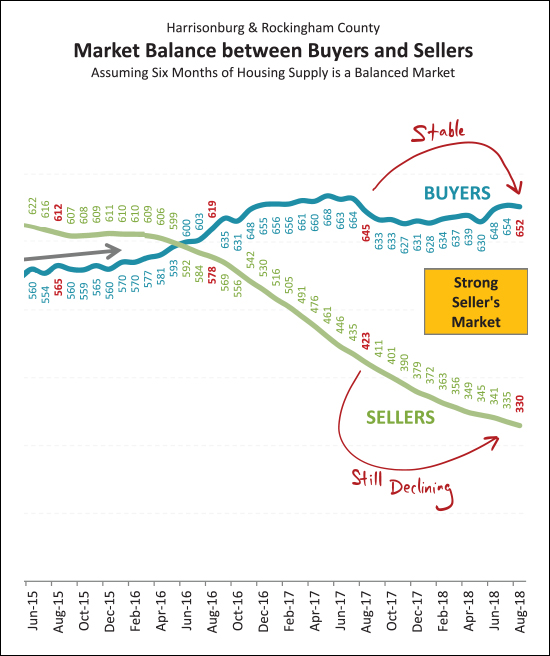
The balance (or imbalance) between buyers and sellers doesn't show any signs of shifting any time soon. After multiple years of increasing buyer activity we are now seeing a relatively stable number of buyers in the market -- around 650 every six months. But at the same time, inventory levels continue to decline -- making it an even stronger seller's market -- with the usual disclaimers of "in most areas, in most price ranges, for most property types, etc."
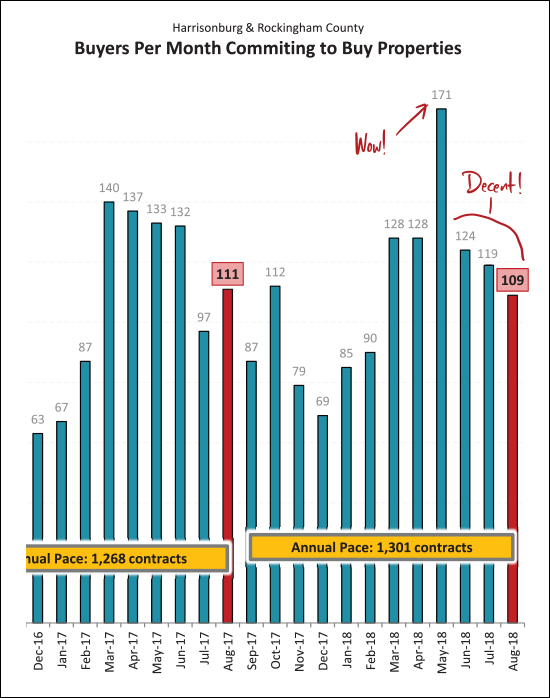
The huge month of sales in June 2018 was foretold by the enormous month of contracts in May 2018. Since that time, we've seen relatively normal months of contract activity. The 109 contracts signed in August 2018 is pretty much in line with the 111 contracts we saw last year. Looking forward, we're likely to see a dip in contract activity in September, possibly a spike in October, before much lower contract numbers between November and February.
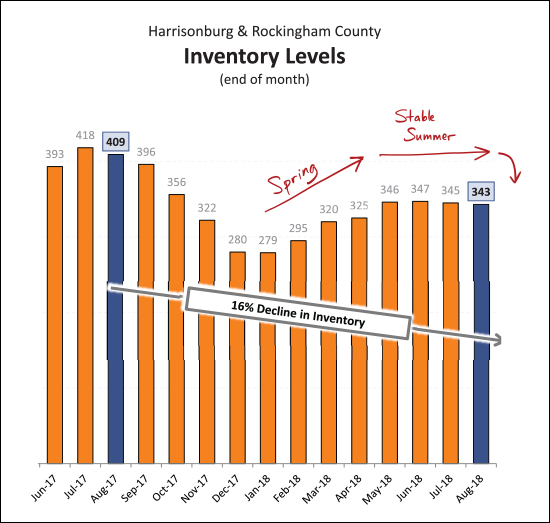
If you thought inventory levels have been low recently, you haven't seen anything yet. After a 16% year over year decline, we're about to head into the Fall and Winter where we inevitably see fewer homes on the market. It seems likely we'll dip below the 300 homes for sale mark again as we did last December and January. An increase in new construction is likely the only thing that can break this drought of listing inventory.
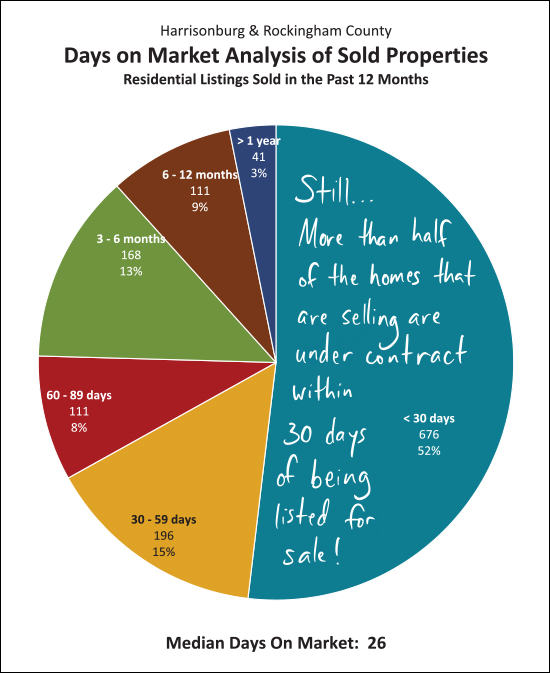
This is absolutely no consolation at all to any home seller who has had their home on the market for 2, 3, 4, 6 or 10 months -- but for sellers about to put their homes on the market, you have a decent chance of selling your home quickly -- again, depending on price point, location, features, finishes, condition, marketing, etc. But, as shown above, slightly more than half of the homes that sold in the past year were under contract within 30 days of being listed for sale.
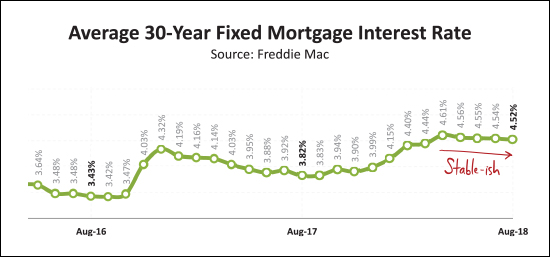
Yes -- interest rates have risen over the past year -- by about 0.75%, which we shouldn't minimize. That said, at 4.5% -- which seems to be where we are hovering for the moment -- this doesn't seem to be drastically changing buyer behavior or housing affordability.
OK -- I'll stop there for now. Again, you can download the full report as a PDF, or tune in to my monthly video overview of our local housing market
And a few tips for anyone thinking of buying or selling soon --
And a few tips for anyone thinking of buying or selling soon --
SELLERS -- even though it is a seller's market in many price ranges right now, you must still focus on price, condition and marketing.
For further reading on buying or selling in this area, check out....

