Brought to you by Scott P. Rogers, Funkhouser Real Estate Group, 540-578-0102, scott@HarrisonburgHousingToday.com
Brought to you by Scott P. Rogers, Funkhouser Real Estate Group, 540-578-0102, scott@HarrisonburgHousingToday.com
Monday, July 9, 2018
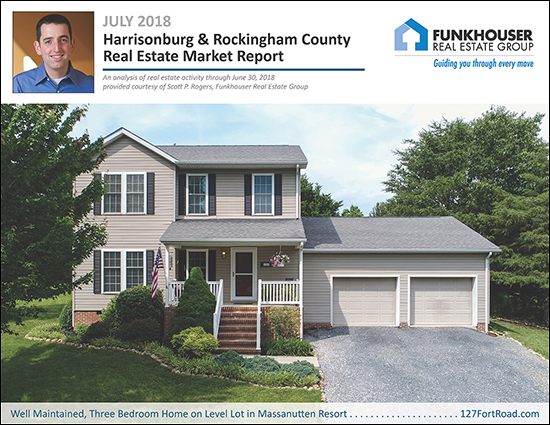
Learn more about this fantastic home in Massanutten Resort: 127FortRoad.com.
I just published my most recent monthly market report, and as usual, you can read on for an overview, download the full report as a PDF, read the entire report with commentary online, or tune in to my monthly video overview of our local housing market...
OK -- now, let's take a look at some of the overall market indicators this month...
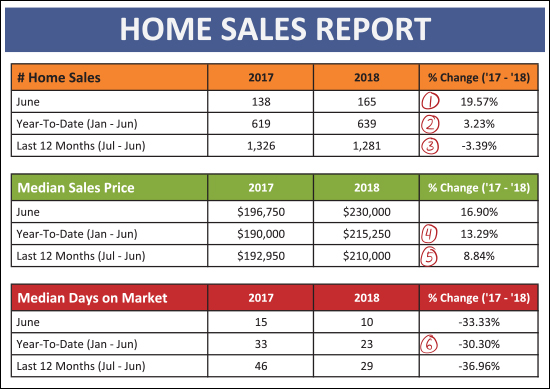
As shown above...
- The 165 home sales seen in June 2018 was a 19.57% improvement over the mere 138 home sales seen last June.
- A strong month of home sales in June helped bring the year-to-date home sales pace up to 639 home sales -- a 3.23% improvement over last year at this point.
- In the past year we have seen 1,281 home sales which is actually a 3.39% decline from the number seen in the previous 12 months.
- In the first half of this year, the median sales price has been $215,250 -- a 13.29% improvement over last year when it was $190,000.
- Looking at a slightly longer timeframe, the median sales price over the past year has been $210,000 -- an 8.84% increase over the median sales price of $192,950 seen during the previous 12 months.
- Thus far in 2018, homes are selling with a median days on market of 23 days -- 30% faster than last year's median of 30 days on the market.
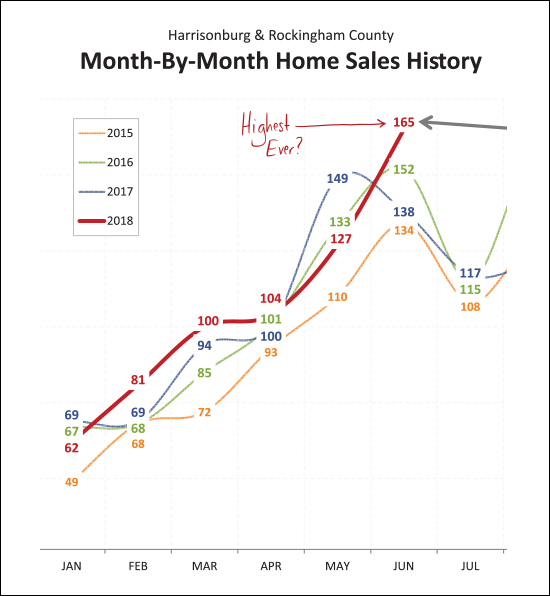
Wow! Just wow! The 165 sales seen in June 2018 is the highest seen any time in the past several years -- in fact -- it is the most sales in a single month any time in the past 10 years! I actually have data back to 2003, and the only times that we have seen more than 165 home sales in a single month have been: June 2004 (174), June 2005 (173), July 2005 (166), August 2005 (183) and June 2006 (192).
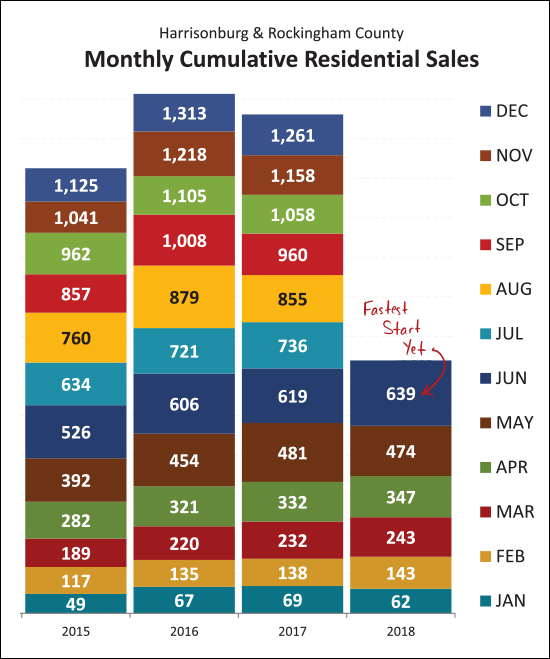
Needless to say, this is the fastest start to the year we have seen anytime in recent history. As shown above, the 639 home sales in the first half of 2018 exceeds the number seen in the first half of the past three years. Looking back further, the only times we saw more home sales in the first half of the year were in 2004 (706), 2005 (764) and 2006 (759).
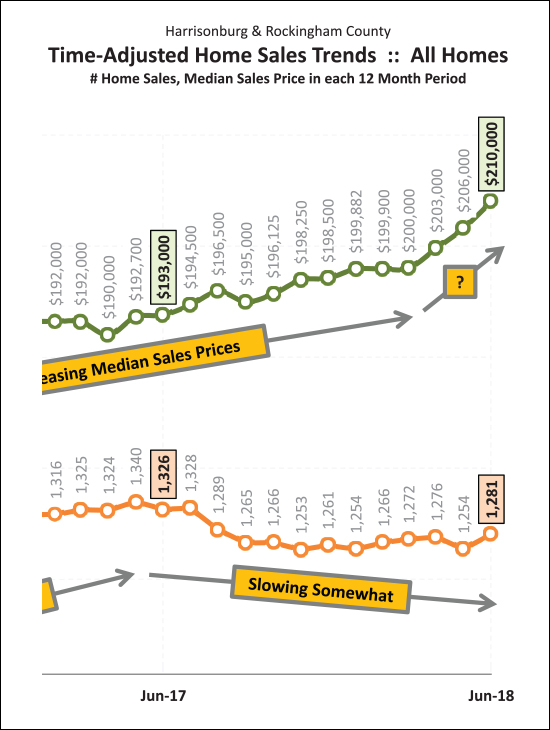
As shown above, despite slowing sales over the past year-ish, median sales prices have been slowly rising -- and over the past three months have started escalating quickly -- from $200K to $210K between March 2018 and June 2018.
So -- record numbers of sales, quickly rising prices -- hmmm -- something about this seems familiar. Should we be worried? Maybe, or maybe not...
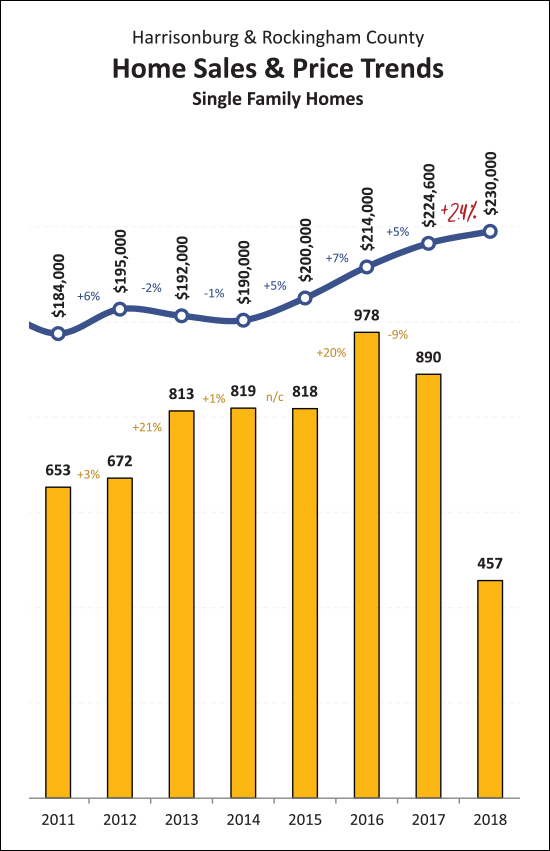
The figures shown in all prior charts and graphs has been for all residential sales -- including detached homes, duplexes, townhouses and condominiums. The graph immediately above focuses only on Single Family (detached) Homes and this can often give us the truest indicator of market trends. Perhaps it is (or could be) some comfort, then, that the median sales price of these detached homes has only risen 2.4% over the past year. This may mean that the rapid increases in prices we are seeing has more to do with what is selling (property type, price range) and/or is being skewed by non-owner occupied home sales/purchases.
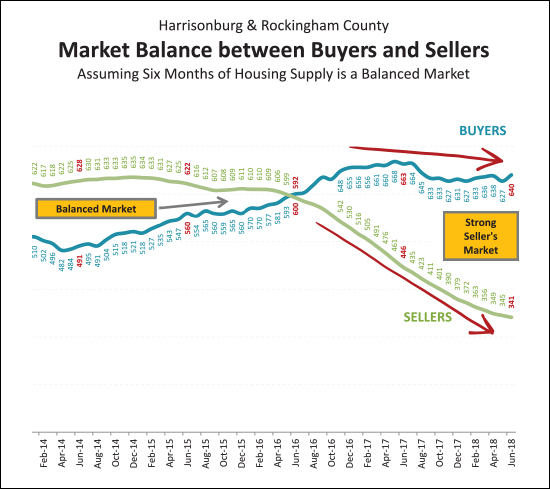
It is also important to note that while the number of home sales has been dropping slowly (3% decline comparing past 12 months to prior 12 months) part of that may be due to a change in market balance. It is a strong seller's market now, as there are a roughly equivalent number of buyers in the market as compared to a year ago -- with a drastically lower number of sellers in the market.
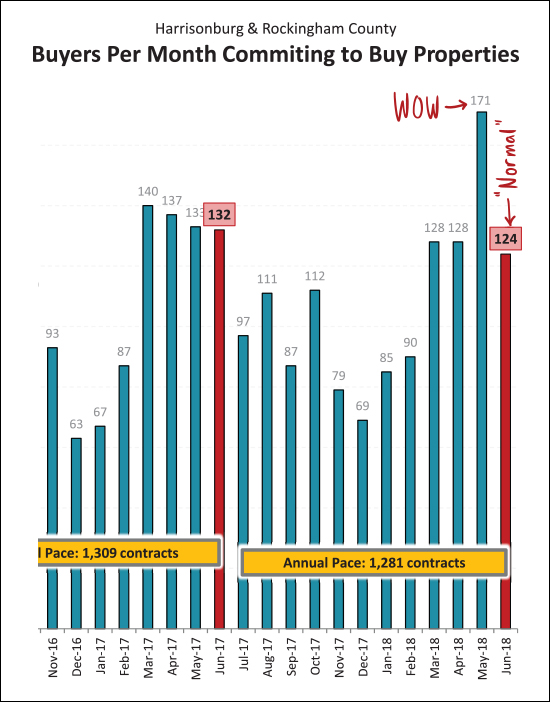
And here, folks, is the reason why we saw so many home sales this month -- it was a result of the crazy number of contracts signed last month. Last month's 171 contracts was the highest number I have seen anytime since I have been tracking these figures. Thus, slightly slower contracts in June is to be expected -- and we are likely to still see a strong month of sales in July based on some May contracts rolling over into July closings.
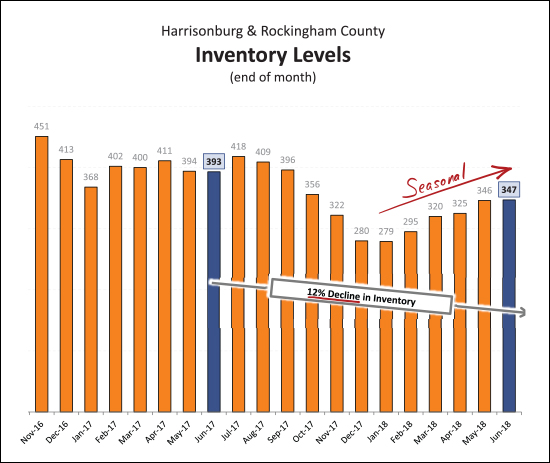
And here it is again -- declining inventory levels. While inventory levels have seen a seasonal increase over the past six months, there has been a net year-over-year decline of 12% in the number of homes on the market. Fewer homes for sale, with a roughly equivalent number of home buyers, has lead to a strong seller's market -- and a frustrating time for many buyers!
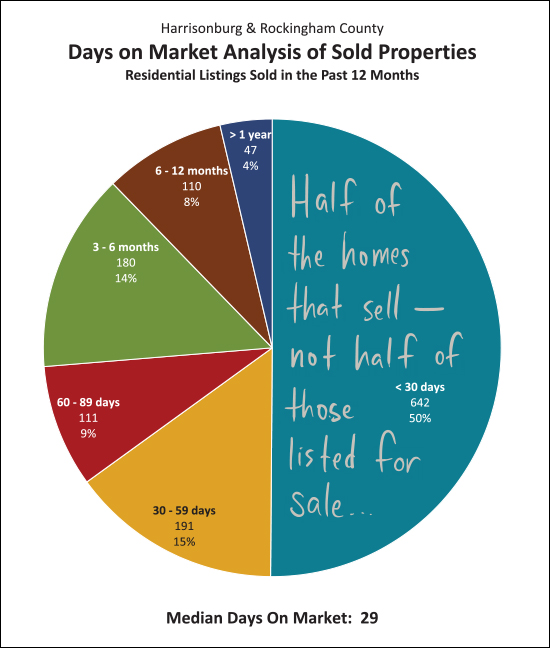
Perhaps because there are so many buyers fighting over each listing, homes are selling more quickly. Half of the homes that have sold in the past year have been under contract within 30 days of having been listed for sale. Again, this is not half of all properties that are listed going under contract in 30 days -- just half of those that actually do sell.
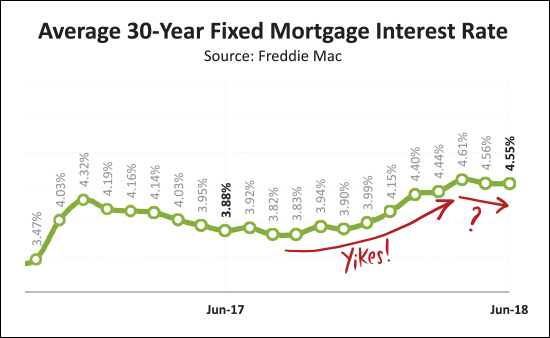
As shown above, mortgage interest rates have been increasing over the past year -- almost an entire percentage point. This has not seemed to have made a drastic difference in the pace of buyer activity (yet) and it has been nice to see these edge downward somewhat over the past few months.
OK -- I'll stop there for now. Again, you can download the full report as a PDF, read the entire report with commentary online, or tune in to my monthly video overview of our local housing market
One last note for anyone thinking of buying or selling soon --
SELLERS -- even though it is a seller's market in many price ranges right now, you must still focus on price, condition and marketing.
For further reading on buying or selling in this area, check out....

