Brought to you by , Funkhouser Real Estate Group, , scott@HarrisonburgHousingToday.com
Tuesday, November 21, 2017

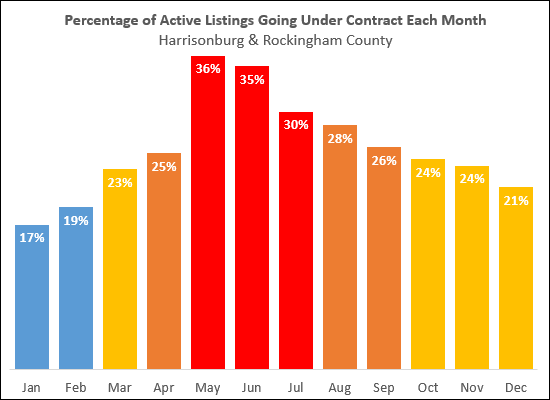
The graph above examines what percentage of active listings went under contract in each of the past12 months -- thus, accounting for both fluctuation in buyer activity as well as fluctuation in inventory levels.
It seems you are least likely to sell your home (have it go under contract) in January or February -- when less than 1 in 5 homes goes under contract. That is in stark contrast to May through July where approximately 1 in 3 homes goes under contract each month.
