Brought to you by Scott P. Rogers, Funkhouser Real Estate Group, 540-578-0102, scott@HarrisonburgHousingToday.com
Brought to you by Scott P. Rogers, Funkhouser Real Estate Group, 540-578-0102, scott@HarrisonburgHousingToday.com
Thursday, December 22, 2016

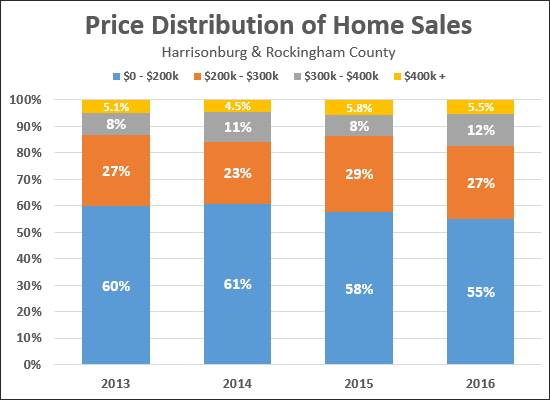
I thought we might actually see more change in these figures over time than we do see when looking at the data. The graph above shows the percentage of buyers (for this year and the three prior years) who purchase in each of the four main price ranges that I analyze each month.
A few observations....
- More than half of buyers spend less than $200K -- though this figure does not just look at owner occupant purchasers, and most investment property purchasers would end up in this price range.
- The percentage of buyers spending less than $200K has declined over the past few years from 60% down to 55%.
- The only price range to see a sizable proportional increase in buyers in the past year has been the $300K - $400K price range, which increased from 8% to 12%, though that price range included 11% of buyers the prior year.
- A very small portion (5.5%) of our market is comprised of homes over $400K.
You can find out more about the Harrisonburg and Rockingham County real estate market by visiting....
