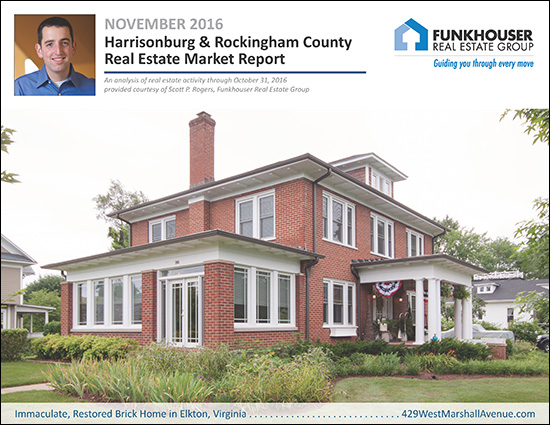
Learn more about this month's featured property: 429 West Marshall Avenue
I just published my monthly report on the Harrisonburg and Rockingham County real estate market. Jump to the full online market report, download the PDF, or read on for highlights....
First, let's take a look at the overall market performance in October....
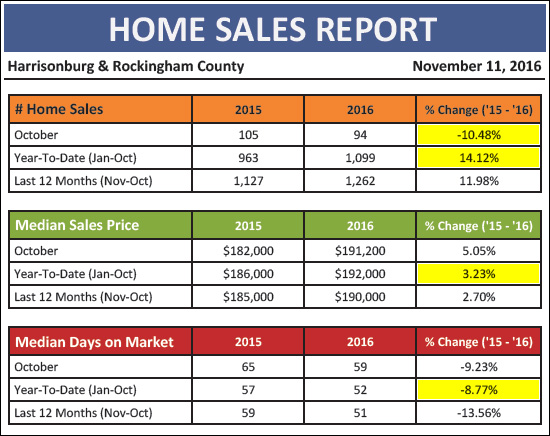
A few highlights from the quick snapshot above....
- Home sales declined 10% in October 2016 to 94 sales -- as compared to last October when there were 105 home sales.
- Year-to-date home sales are still up 14% in 2016 (with 1,099 sales) as compared to the first ten months of 2015 when there were only 963 home sales.
- Median sales prices have risen 3.23% from a year ago from $186K to $192K.
- Homes are selling 9% faster, at a median days on market of 52 days, as compared to 57 days last year.
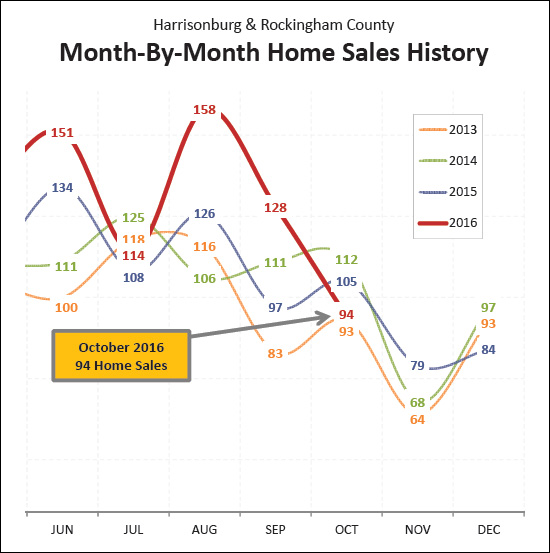
OK -- as noted above, the 94 homes sales seen in October 2016 mark a 10% decline as compared to the 105 home sales in October 2015, and that was even lower than the 112 home sales seen in October 2014. But before you get overly depressed about a slower October, remember....
- There were 158 home sales in August 2016 -- a 25% improvement over August 2015.
- There were 128 home sales in September 2016 -- a 32% improvement over September 2015.
So, it seems that the timing of home sales during the year can vary significantly from year to year. Looking at the past three months together can help put things in perspective in some ways....
- There were 328 home sales between August and October of 2015.
- There were 380 home sales between August and October of 2016.
There, not so bad now, right? That's a 16% improvement over last year when looking at these three months -- and as noted above, when looking at January through October, the pace of home sales in 2016 is 14% higher than it was last year.
OK, on to some other items....
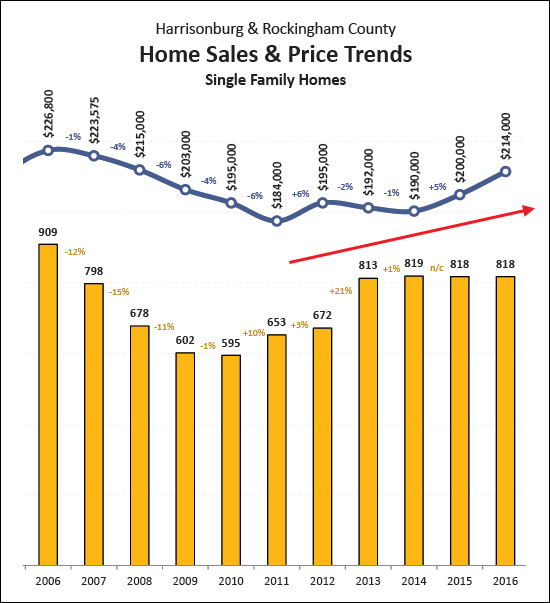
The median value of single family (detached) homes is often the best indicator of trends in home values in a local housing market. As shown above, we have been seeing those values increase over the past five years, most notably over the past two years.
Also of note, as shown above, after hovering between 810 and 820 home sales per year for the past three years, it seems we are finally poised to break through that invisible barrier this year, as we are likely to see at least 900 and perhaps 950 single family home sales.
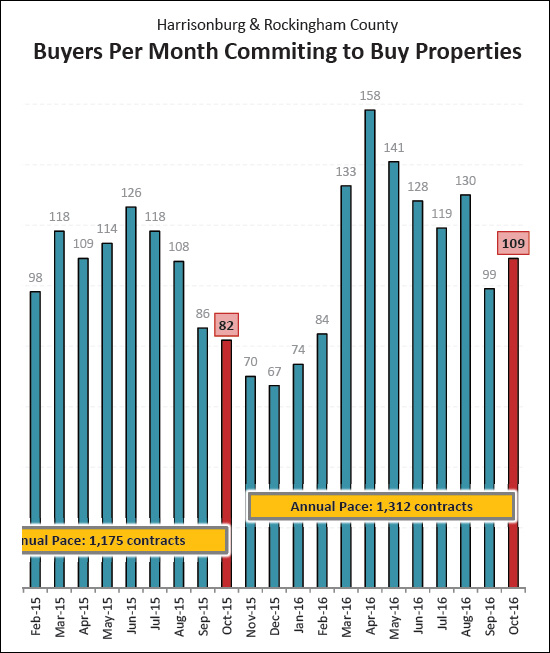
If my consoling notes above about why slower October home sales weren't so bad didn't help, then perhaps the graph above will help. Slower home sales in October 2016 does not mean that the fast and furious pace of 2016 home sales has come to an end. As shown above, buyers (and sellers) signed 109 home sales in October 2016 -- a 33% increase over the 82 contracts signed last October. So -- we might be in for another month of stronger sales in November.
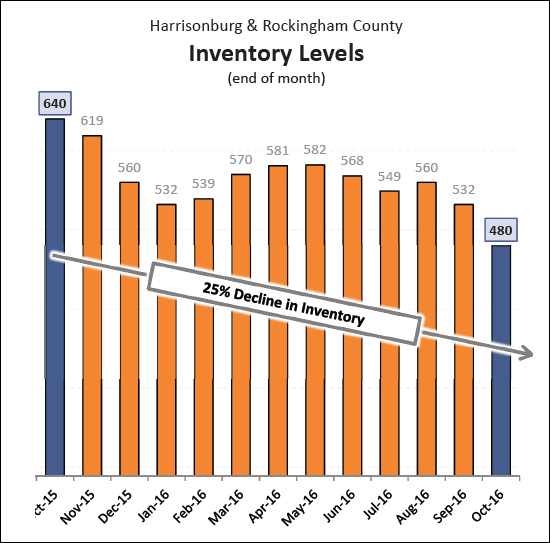
If you are trying to buy a home right now, it is quite possible that you are frustrated by not having many options to choose from. The graph above might explain why you are having this experience. Inventory levels continue to fall -- to where we now only have 480 homes on the market!?!?! This is as compared to a year ago when there were 640 homes on the market at this time -- showing a 25% year-over-year decline. This lack of inventory is slowly starting to tip the market in the favor of sellers, though not in all price ranges and not in all locations.
OK, there is plenty more to say, such as....
- Median price per square foot of single family homes has increased from $108 to $113 over the past year.
- The median list price to sales price ratio has increased from 97% to 98% over the past year.
- Sales of newly built homes are much higher (73 thus far) this year than last year (total of 54).
- 54% of homes that sell go under contract within 60 days of being listed for sale.
- There has been a 41% year-over-year increase in the sale of $300K - $400K homes.
- There are only three months of supply of homes under $200K currently on the market.
But -- I'll let you read all about those tidbits via my full online market report, or by downloading the PDF, or by clicking here to sign up to receive my real estate blog by email.
And -- as is always my encouragement -- if you will be buying or selling a home in the near future, start learning about our local housing market sooner rather than later! Being informed will allow you to make better real estate decisions.
Here are two handy references to prepare yourself to buy or sell a home....
