
Learn more about this month's Featured Property: 4140 Brown Roan Lane
I just published my monthly report on the Harrisonburg and Rockingham County real estate market. Jump to the full online market report, watch the video overview below, download the PDF, or read on for highlights....
First, a video overview....

Now, let's take a look at the overall market performance in June....
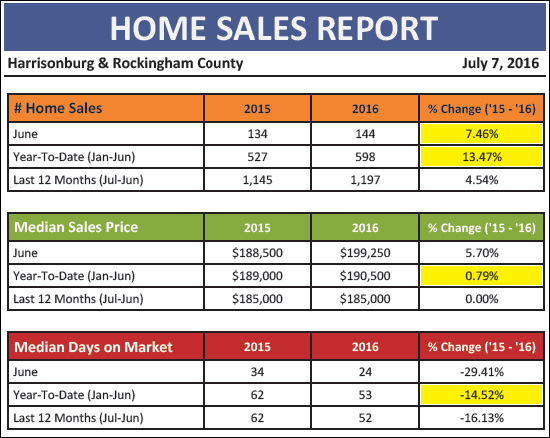
As shown above....
- June home sales rose 7.46% to 144 home sales.
- Year-to-date home sales are up 13.47% as compared to last year!
- Prices are relatively flat, with only a 0.79% year-over-year improvement.
- Homes are selling 14.52% more quickly this year as compared to last year.
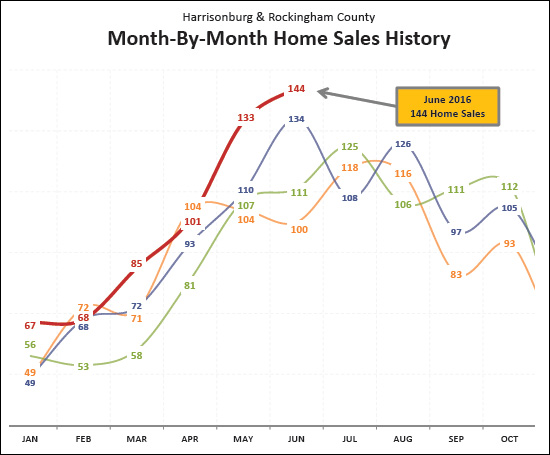
OK -- BIG NEWS HERE -- June 2016 home sales were "off the charts" as they say -- the highest month of monthly home sales we have seen in a LONG TIME! Actually, looking back further that this chart -- the last time we had more than 144 home sales was back in June 2007 -- at the peak of the market boom.
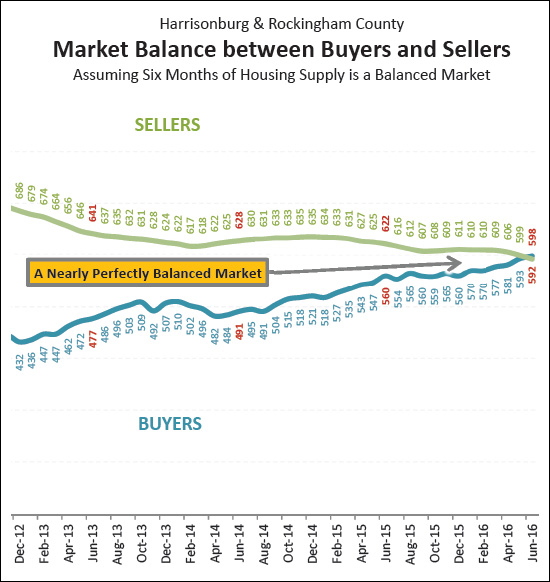
AND -- MORE BIG NEWS -- It happened! It really happened! Most housing market analysts consider six months of inventory (active listings) to be an indicator of a balanced market (between buyers and sellers). The “BUYERS” trend line above is illustrating how many buyers are buying in a six month period. The “SELLERS” trend line above is illustrating how many sellers are in the market (active listings) at any given time. Over the past four years we have seen a steady increase in buyers and a declining number of sellers. And finally, in June, these two trajectories have crossed! There are more buyers buying in a six month period than there are homes for sale!
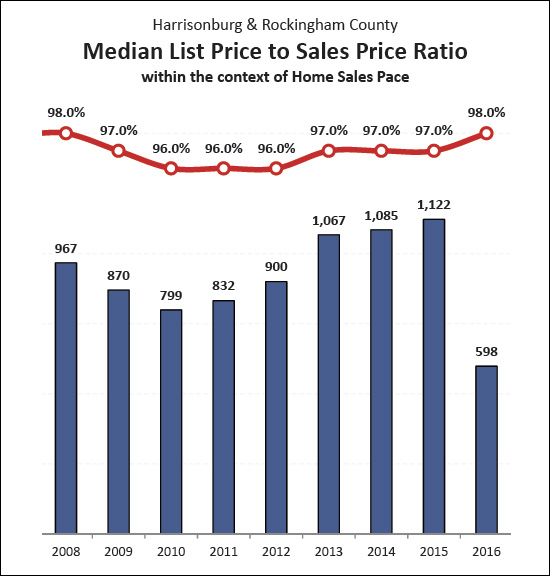
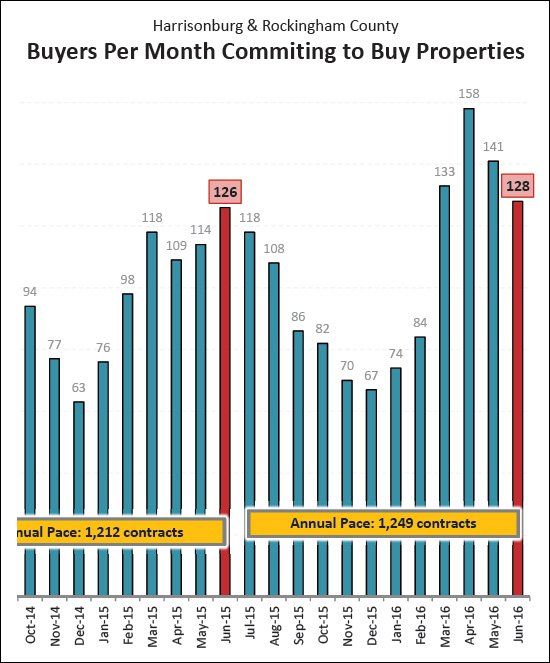
Finally, what should we expect as far as sales for the next few months? Based on recent contract activity, I am thinking we'll see another strong month of sales during July. To put this year in perspective, we have seen an average of 140 contracts per month over the past four months -- as compared to an average of only 117 contracts per month during the same timeframe in 2015.
There is more, oh so much more, in my full real estate market report. I have even made it very easily accessible for you to read online....

And as is always my encouragement -- if you will be buying or selling a home in the near future, become a student of the housing market! Learn what has been happening recently, what is happening now, and what is likely to happen next. Being informed will allow you to make better real estate decisions.
Here are two handy references to prepare yourself to buy or sell....
