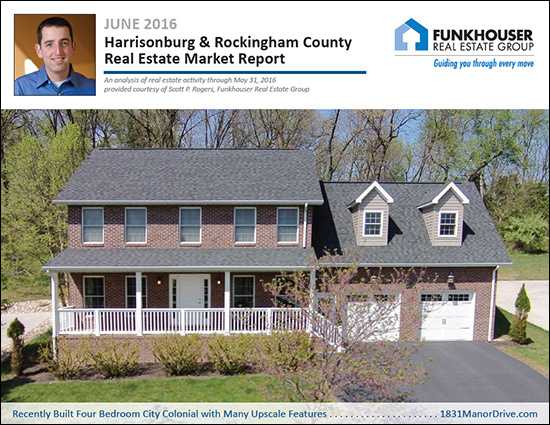
Learn more about this month's Featured Property: 1831 Manor Drive
I just published my monthly report on the Harrisonburg and Rockingham County real estate market. Jump to the full online market report, watch the video overview below, or download the PDF, or read on for highlights....
First, a video overview....

Now, let's take a look at the overall market performance in May....
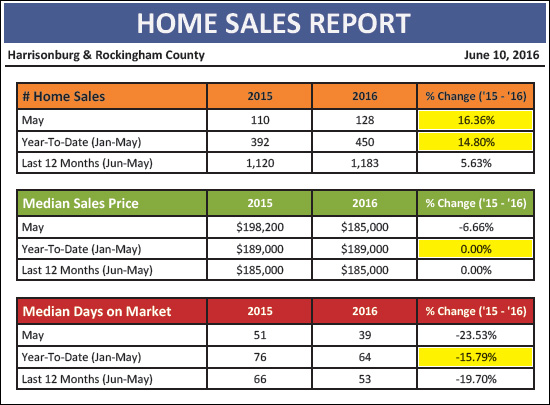
The local housing market is, again, showing signs of strength....
- Home sales increased 16% in May 2016 to 128 home sales.
- YTD home sales have increased 15% to 450 home sales.
- Year-to-date median sales prices are steady at $189,000.
- Homes are selling 16% faster this year as compared to last year.
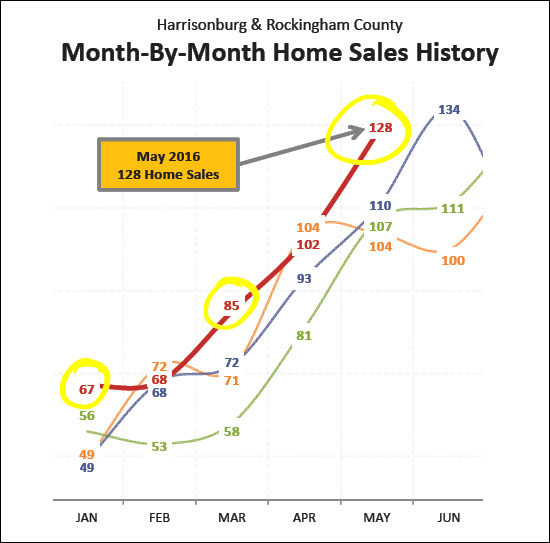
As shown above, there have been several months in particular -- January, March, May -- that have catapulted us to our current 15% improvement in home sales this year as compared to last year.
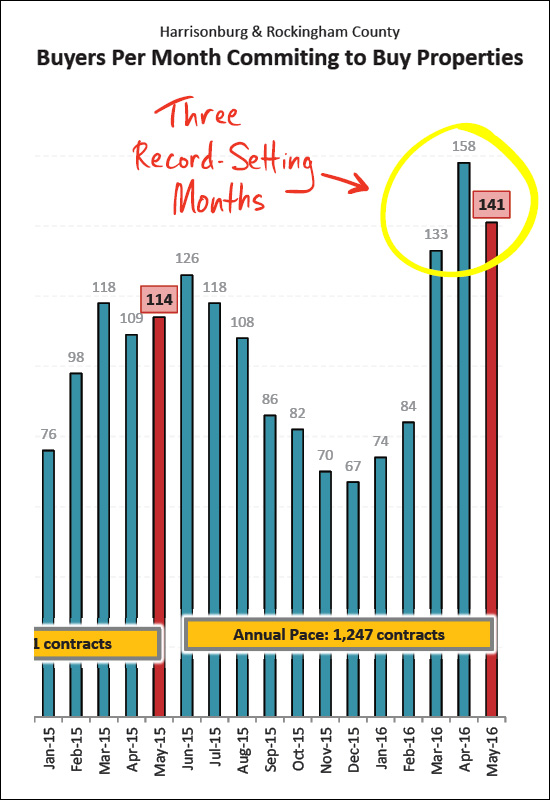
We have seen buyers signing contracts in record numbers over the past three months -- which bodes well for strong sales in June as well as (likely) July.
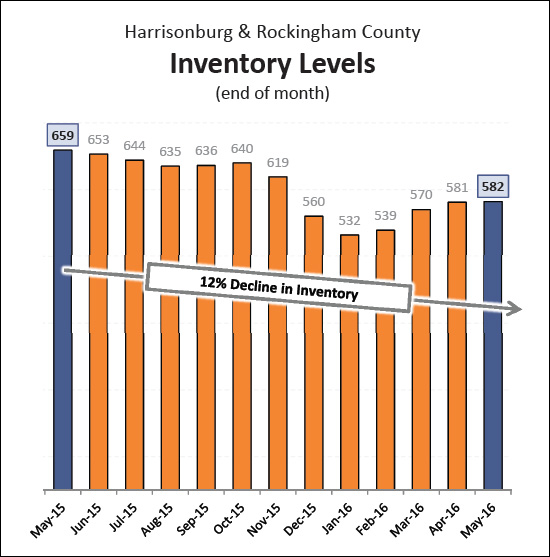
Buyers are buying faster than sellers are ready to sell. Inventory levels, as shown above, have declined 12% over the past year. Buyers are seeing fewer and fewer choices of homes to purchase.
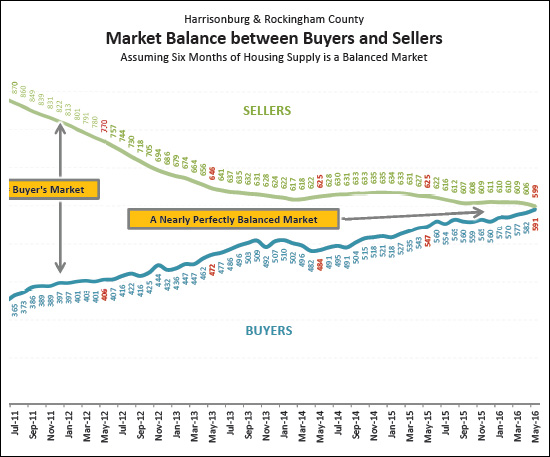
Finally, the market graph we've all been waiting for -- as shown above, we are finally (!) approaching a perfect balance between buyers and sellers in our local market -- with almost exactly six months of supply available. This is a result of a slowly increasing pace of buying activity over the past few years -- and a slowly declining inventory level during the same timeframe.
BUT WAIT -- remember -- all real estate is local, and sometimes that means down to the city, town or even neighborhood. If you are getting ready to sell your home, we should start by looking at these overall trends -- but then we'll need to dive much deeper into the analysis of your price range, neighborhood. property type, etc.
There is more, oh so much more, in my full real estate market report. I have even made it very easily accessible for you to read online....

And as is always my encouragement -- if you will be buying or selling a home in the near future, become a student of the housing market! Learn what has been happening recently, what is happening now, and what is likely to happen next. Being informed will allow you to make better real estate decisions.
Here are two handy references to prepare yourself to buy or sell....
