Brought to you by Scott P. Rogers, Funkhouser Real Estate Group, 540-578-0102, scott@HarrisonburgHousingToday.com
Brought to you by Scott P. Rogers, Funkhouser Real Estate Group, 540-578-0102, scott@HarrisonburgHousingToday.com
Friday, August 21, 2015

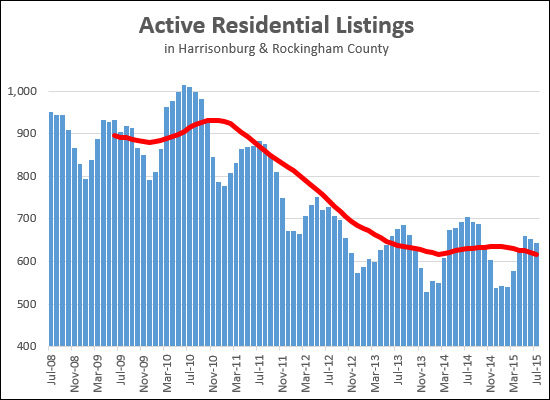
If you think there aren't many homes for sale, it's because there aren't many homes for sale. The graph above shows how inventory levels in our area have shifted downward over the past seven years.
Looking at inventory levels at the start of each August, here's what we find....
- 2008 = 951
- 2009 = 904
- 2010 = 1,010
- 2011 = 882
- 2012 = 727
- 2013 = 676
- 2014 = 705
- 2015 = 644
Past years indicate that we will likely see inventory levels continue to decline over the next five to six months.
