Brought to you by , Funkhouser Real Estate Group, , scott@HarrisonburgHousingToday.com
Thursday, April 9, 2015

(this one deserves a larger image, click here to view it)
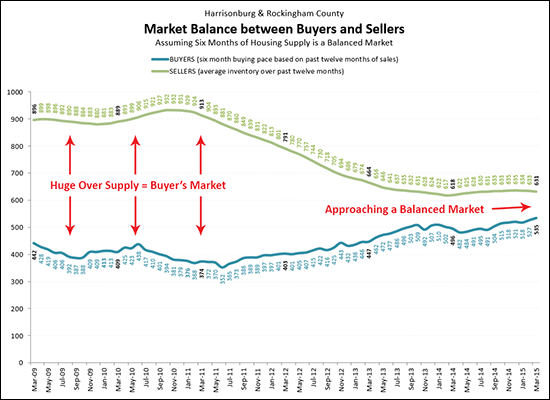
Q: Have we reached a balance between buyers and sellers in our local housing market?
A: We're not quite there, but we are a lot closer than we have been anytime in the past six years!
Here's the methodology behind the chart above....
- Most housing market analysts consider six months of inventory (active listings) to be an indicator of a balanced market (between buyers and sellers).
- The "BUYERS" trend line above is illustrating how many buyers are buying in a six month period - though I have normalized this trend line for market seasonality by looking at it over a twelve month period. Thus, every data point is the sum of the previous twelve months of sales, divided by two.
- The "SELLERS" trend line above is illustrating how many sellers are in the market (active listings) at any given time - though I have normalized this trend line for market seasonality by averaging the previous 12 months of inventory levels to arrive at each data point.
Read more about the local housing market in my most recent monthly housing market report....

Jump to the full online market report, or download the PDF.
