Brought to you by Scott P. Rogers, Funkhouser Real Estate Group, 540-578-0102, scott@HarrisonburgHousingToday.com
Brought to you by Scott P. Rogers, Funkhouser Real Estate Group, 540-578-0102, scott@HarrisonburgHousingToday.com
Wednesday, February 25, 2015

OK, my apologies in advance for the slightly depressing nature of this blog post. This is the third in a series of three -- and I'm only going here because someone (Brad!?!) asked the question, so I thought I'd run the analysis to shed some light on his inquiry.
Brad's question....
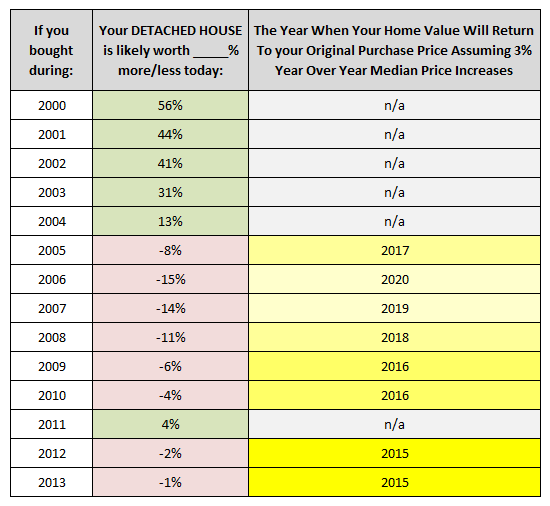
So, let's say one bought a house in 2009 (hypothetically, of course, right?!)... Or any of the other "red" years above. What's the thought on a reasonable expectation for a house to at least recover the value to the purchase price (and then, of course, hopefully, higher)? Not that you have a crystal ball, but in general?OK, so, first of all -- the values in the middle (red and green) column above are showing the potential current value of your home depending on when in the past 15 years you purchased the home. Basically, those folks who purchased before (2000-2004) the real estate boom have higher home values now than when they purchased their home -- and most people who bought since then do not have a higher home value today. That is because after single family home values peaked in 2006, they have been slowly (slowly!!) drifting downward since that time. (details here)
So, back to Brad, he is wondering how long it will take homes to return to the value that they had when they were purchased. As shown above in the right (grey and yellow) column, we can sort of guess as what that time frame will look like if we assume that home values will increase 3% per year over the next five (etc.) years. Working our ways sort of backwards, this analysis shows that....
- Buyers from 2011 are good to go -- their home values are likely already higher than they were when they purchased their home.
- Buyers from 2012 and 2013 are likely to see a return to their original home value in 2015.
- Buyers from 2009 and 2010 are likely to see a return to their original home value in 2016.
- Buyers from 2005 - 2008 are likely to see a return to their original home value somewhere between 2017 and 2020. See the chart for details.
- The data above is analyzing changes in the median sales price of single family homes - thus, your house's value is likely to follow these general trends, but this is not an absolute guide.
- Certainly, if we don't see 3% per-year increases in the median values of single family homes over the next five (etc.) years, then this analysis will not be accurate.
- Plenty of people put down a small (or large) down payment when purchasing. This, thus, gives them the flexibility to be able to sell in the future even if their home value has shifted downwards a bit.
- When you pay your mortgage each month, you are reducing the principal balance, again, giving you further flexibility to sell in the future even if your home value has shifted downwards a bit.
- Fluctuations in market value over time are cancelled out (in some ways) if you are selling and buying at the same time. Sad that your used-to-be-$300K home is selling for $280K? Don't be. You're buying a used-to-be-$350K home for $325K.
OK, enough for now. Hopefully this is a helpful look at the implications of shifting market values over time. If you have a question about the value of your home, please let me know. I'd be happy to meet with you to give you some specific feedback pertinent to your home -- as compared to the generalities referenced above.
And, for the data lovers out there, feel free to peruse lots of market indicators and graphs at HarrisonburgHousingMarket.com.
P.S. Don't like the harsh realities presented herein? Complain to Brad. :)
