Brought to you by , Funkhouser Real Estate Group, , scott@HarrisonburgHousingToday.com
Thursday, February 7, 2013

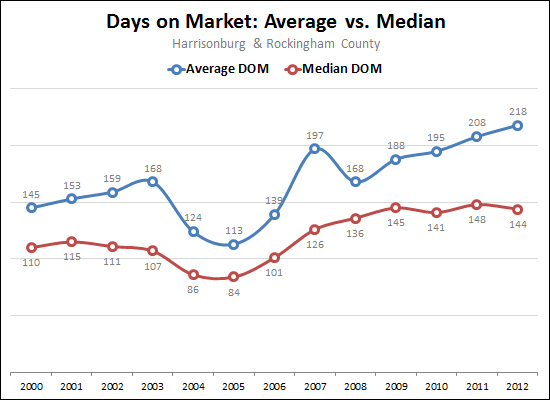
The health of our local housing market has improved over the past year, but the one metric that has continued to appear quite depressing has been "Average Days on Market" -- shown above in blue. This is the average number of days between the listing date and closing date of properties that have actually sold.
I have always used AVERAGE days on market, as that seems to be used quite widely in the industry as the best metric, but based on the encouragement of several of my blog readers, I have (finally) looked at how the MEDIAN days on market trend differs.
As shown above, the Median Days on Market trend (red) seems to be a much better indication of how long it takes for a house to sell in our market.
As the mathematicians among you know, an AVERAGE can be greatly skewed by outliers, for example some houses that have finally (!!) been selling over the past year or two that had extremely high days on market. A MEDIAN value is a better indicator of "central tendencies" when there are a significant number of outliers.
Thus, in 2012, half of the homes that sold did so in less than 144 days, and half did so in more than 144 days. I believe that is much more helpful data than an average of 218 days on the market!
