Brought to you by Scott P. Rogers, Funkhouser Real Estate Group, 540-578-0102, scott@HarrisonburgHousingToday.com
Brought to you by Scott P. Rogers, Funkhouser Real Estate Group, 540-578-0102, scott@HarrisonburgHousingToday.com
Thursday, February 17, 2011
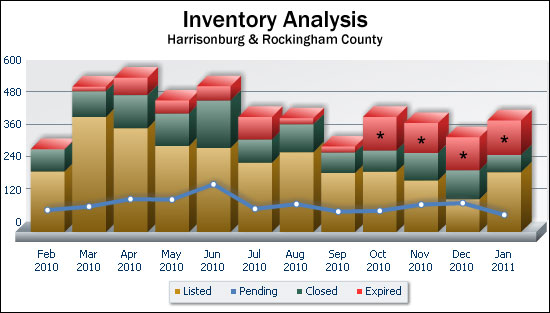
As referenced a few days ago, the inventory of listed homes in Harrisonburg and Rockingham County has dropped significantly (by 23%) over the past six months. But as Pete Seeger might ask... where have all the listings gone?

It turns out the listings expired. Take a look at the huge chunk of listings that expired during each of the past four months (Oct, Nov, Dec, Jan) -- each is a red bar with a star in it.
As long as those late-2010 expired listings don't turn into early-2011 new listings, the market might stand a chance of heading towards more stability. Stay tuned!
For the analytical minds amongst us, a few notes about the data:
- The sum total of each bar does not represent all listings, but rather the sum of changes in listings. The gold portion represents the number of new listings, the green portion shows the sold listings, the red portion shows expired listings, and the blue line shows the number of pending contracts.
- The data in the chart above (unlike nearly every other chart I've ever presented to my devoted readers) is based on the entirety of the Harrisonburg / Rockingham MLS. This includes listings well outside Harrisonburg and Rockingham County, so this chart gives us relatively helpful insight at our local market, but not with any great precision.
