Brought to you by , Funkhouser Real Estate Group, , scott@HarrisonburgHousingToday.com
Wednesday, October 28, 2009
Sort of....but maybe not effectively??
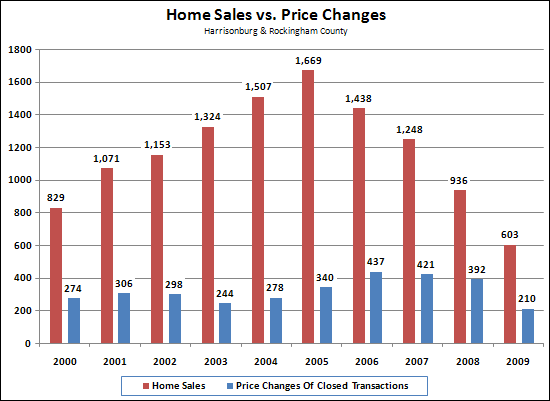
The chart below shows the number of price changes per year of homes that have sold for each of the past nine years. Some houses that sold may have had multiple price changes --- these figures show the total number of price changes, counting each change on each property.

There was a sharp increase (+29%) in price changes in 2006 (compared to 2005), which would be expected because it was the first year of a reduced number of home sales. However, there was also a sharp increase (+22%) in 2005 (compared to 2005) when the market was still peaking.
Perhaps of even more interest is that the number of price reductions per year has slowly decreased over the past several years (-4% in 2007, -7% in 2008). This may be explained by the declining number of home sales, as the number of price changes shown above only accounts for price changes of listings that have sold.
This year there have been approximately 600 home sales, and roughly 200 price changes of those homes that have sold . . . but nearly 700 price changes when we include the many houses that are still on the market.
Stay tuned for more analysis of how price changes affect the sale of your house.
The chart below shows the number of price changes per year of homes that have sold for each of the past nine years. Some houses that sold may have had multiple price changes --- these figures show the total number of price changes, counting each change on each property.

There was a sharp increase (+29%) in price changes in 2006 (compared to 2005), which would be expected because it was the first year of a reduced number of home sales. However, there was also a sharp increase (+22%) in 2005 (compared to 2005) when the market was still peaking.
Perhaps of even more interest is that the number of price reductions per year has slowly decreased over the past several years (-4% in 2007, -7% in 2008). This may be explained by the declining number of home sales, as the number of price changes shown above only accounts for price changes of listings that have sold.
This year there have been approximately 600 home sales, and roughly 200 price changes of those homes that have sold . . . but nearly 700 price changes when we include the many houses that are still on the market.
Stay tuned for more analysis of how price changes affect the sale of your house.
