Brought to you by Scott P. Rogers, Funkhouser Real Estate Group, 540-578-0102, scott@HarrisonburgHousingToday.com
Brought to you by Scott P. Rogers, Funkhouser Real Estate Group, 540-578-0102, scott@HarrisonburgHousingToday.com
Wednesday, June 11, 2008
In my June 2008 home sales report, I noted that the median sales price of single family homes and townhomes in Harrisonburg and Rockingham County had declined by 3.13% between May 2007 and May 2008.
I was a bit surprised to see this, as home values still seem to be increasing in this area. So....I thought I'd take a closer look at median sales price trends....and here's what I found....

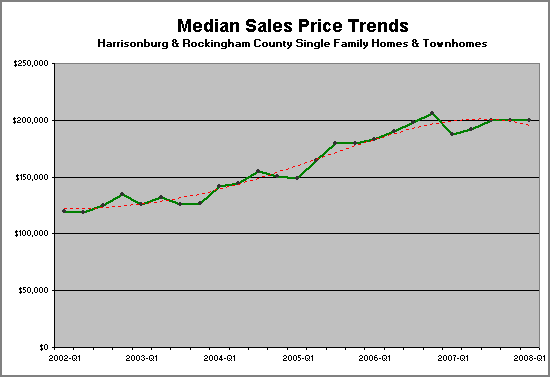
This graph charts the median home sales price on a quarter by quarter basis for the past 25 quarters (6.25 years). The data points of the median home sales price are in gray, connected by the green line. You'll see that the median home sales price goes down (quarter to quarter) almost as often as it goes up.
We could, thus, conclude that either:
The red trend line may give us a better indication of the changes in home values over time --- though suggesting that significant trend data could rise out of insignificant source data is probably a stretch.
Click on the graph to take a closer look.
I was a bit surprised to see this, as home values still seem to be increasing in this area. So....I thought I'd take a closer look at median sales price trends....and here's what I found....

This graph charts the median home sales price on a quarter by quarter basis for the past 25 quarters (6.25 years). The data points of the median home sales price are in gray, connected by the green line. You'll see that the median home sales price goes down (quarter to quarter) almost as often as it goes up.
We could, thus, conclude that either:
- home sales prices (and home values) are almost as likely to go down in any given quarter as they are to go up
- we don't have a large enough number of home sales in this area to make this type of analysis statistically significantly
The red trend line may give us a better indication of the changes in home values over time --- though suggesting that significant trend data could rise out of insignificant source data is probably a stretch.
Click on the graph to take a closer look.
