Brought to you by Scott P. Rogers, Funkhouser Real Estate Group, 540-578-0102, scott@HarrisonburgHousingToday.com
Brought to you by Scott P. Rogers, Funkhouser Real Estate Group, 540-578-0102, scott@HarrisonburgHousingToday.com
Wednesday, March 5, 2008
Here is a fresh look at inventory levels for Harrisonburg and Rockingham County --- looking at all single family homes and townhomes.
This is a similar analysis as I have provided in past months, with one notable exception . . . see below the graphic . . .

In previous months, I had calculated the rate at which homes were selling using only the previous three months of sales figures. My logic was that if I looked back beyond those three months, it would take too long for short term trends to appear in my calculations.
Today, however, a local builder suggested that short term trends (if they really are short term), could skew these numbers --- and perhaps it would be more helpful to determine the sales per month looking at a larger history than the past three months.
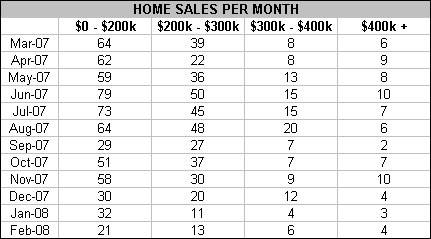
Since I update these figures each month, I decided to make the suggested change --- thus, the data above compares available listings in March 2008 with the average sales per month for March 2007 through February 2008. The full data table is below . . .

This is a similar analysis as I have provided in past months, with one notable exception . . . see below the graphic . . .
In previous months, I had calculated the rate at which homes were selling using only the previous three months of sales figures. My logic was that if I looked back beyond those three months, it would take too long for short term trends to appear in my calculations.
Today, however, a local builder suggested that short term trends (if they really are short term), could skew these numbers --- and perhaps it would be more helpful to determine the sales per month looking at a larger history than the past three months.
Since I update these figures each month, I decided to make the suggested change --- thus, the data above compares available listings in March 2008 with the average sales per month for March 2007 through February 2008. The full data table is below . . .

