Brought to you by Scott P. Rogers, Funkhouser Real Estate Group, 540-578-0102, scott@HarrisonburgHousingToday.com
Brought to you by Scott P. Rogers, Funkhouser Real Estate Group, 540-578-0102, scott@HarrisonburgHousingToday.com
Friday, May 14, 2010

Earlier this week I posted my monthly market report for Harrisonburg and Rockingham County and I pointed out that there were several indicators that suggested we might be seeing an end to the local real estate downturn. Several of you were quite skeptical -- attributing any short-term positive indicators to the tax credit. A few clarifications before I get to some statistics:
- The number of local home sales has declined quite significantly for the past five years. Prices have declined relatively slowly during that same time period. From my perspective, a local housing market recovery will take place when we first start to see more home sales than in the past, and after that we'll see stabilizing and then increasing prices.
- I am NOT sure that we really are seeing a definite and lasting change towards the better in our local housing market. BUT....several key indicators in my market report indicate that we might be.
- It's really o.k. if you are skeptical --- in fact, it's what keeps me on my toes!
First let's look at signed contracts per month:
- March 2010 = 95 contracts
- April 2010 = 121 contracts
- May 1 - 13, 2010 = 46 contracts
Extrapolating, that will likely be 106 contracts for the month!
- May 1 - 13, 2009 = 29 contracts
- May 1 - 13, 2010 = 46 contracts

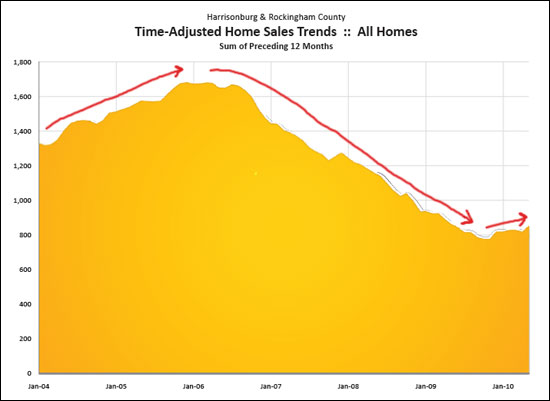
Each data point in the graph above shows the number of sales in a twelve month period. It often takes months for a trend to appear using this metric, but it seems pretty clear to me that over the past six months (which includes data from the last 18 months) we have seen a significantly different trend than we saw between 2006 and 2009.
What do you think? Still skeptical?
