Brought to you by Scott P. Rogers, Funkhouser Real Estate Group, 540-578-0102, scott@HarrisonburgHousingToday.com
Brought to you by Scott P. Rogers, Funkhouser Real Estate Group, 540-578-0102, scott@HarrisonburgHousingToday.com
Wednesday, December 10, 2008
Each month I conduct a thorough analysis of home sales, but most of my analysis takes a look at a monthly snapshot. Thus, at the request of one of my blog readers, I have compiled the monthly data to show a bit more clearly how the Harrisonburg and Rockingham County market has changed from year to year over the past six years.

Bear in mind that all of these charts show 2008 data through December 9, 2008 --- so there will still be a more sales before the 2008 data set is closed out.
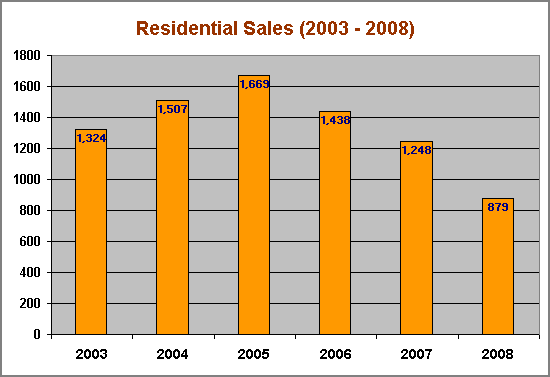
We have seen decreases from 2005 through 2008 --- who wants to guess, will 2009 be an increase over 2008, or will we have to wait for 2010 for an increase?

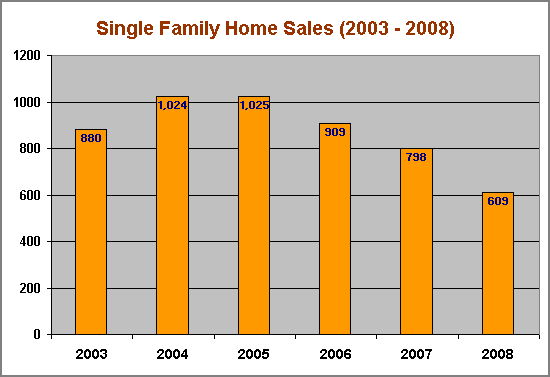
Single family home sales, as we might have imagined, follow a similar trend line to the first graph that showed all residential sales.

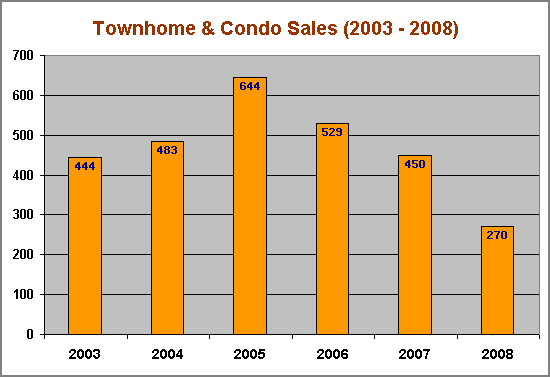
One peculiarity seen here is that there was a sharp increase between 2004 and 2005 in the number of townhouse sales. I suppose 2005 was the year of the townhouse!

Bear in mind that all of these charts show 2008 data through December 9, 2008 --- so there will still be a more sales before the 2008 data set is closed out.
We have seen decreases from 2005 through 2008 --- who wants to guess, will 2009 be an increase over 2008, or will we have to wait for 2010 for an increase?

Single family home sales, as we might have imagined, follow a similar trend line to the first graph that showed all residential sales.

One peculiarity seen here is that there was a sharp increase between 2004 and 2005 in the number of townhouse sales. I suppose 2005 was the year of the townhouse!
