Brought to you by , Funkhouser Real Estate Group, , scott@HarrisonburgHousingToday.com
Friday, June 6, 2008
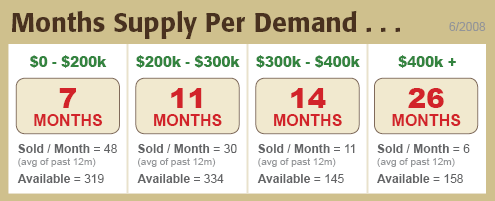
This is an illustration of the relationship between our marketís supply and demand in four price ranges. The numbers (7, 11, 14, 26) represent the months of supply of properties currently available based on average demand per month during the past twelve months.

